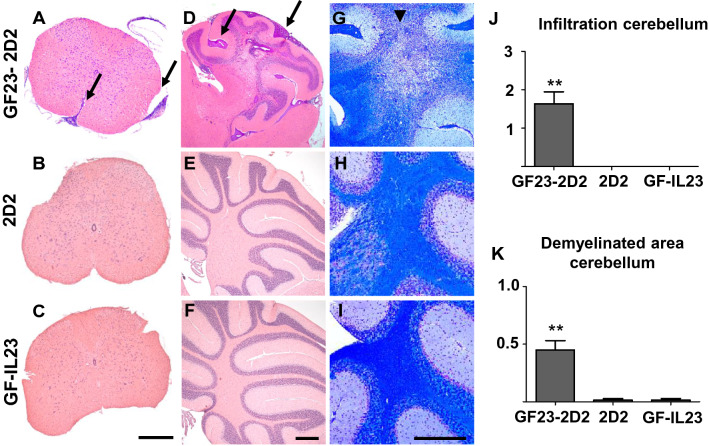
Fig. 2.
Infiltration and demyelination in GF23-2D2 mice. H&E- (A–F) and LFB-staining (G–I) of GF23-2D2, 2D2 and GF-IL23 mice. The myelon (A–C) show infiltration in GF23-2D2 mice, whereas no infiltrates were detected in 2D2 and GF-IL23 mice. The cerebellum (D–F) was highly infiltrated in GF23-2D2 mice with both subarachnoidal and intraparenchymal infiltrates as well as diffuse intraparenchymal infiltration. The cerebellum of 2D2 mice (E) and GF-IL23 mice (F) showed no infiltrates. The LFB-staining displayed demyelinated areas in the parenchyma of the GF23-2D2 cerebellum (G) and no demyelination in 2D2 and GF-IL23 mice (H, I). Arrows point to infiltrates, arrow heads to demyelinated areas. The data are representative of at least six transgenic/WT mice. Scale bar: 100 μm. J Infiltration of the cerebellum was measured on cross-sections of H&E stains with a semiquantitative score reaching from 0 to 3 points (0 = no infiltration, 3 = highly infiltrated tissue). GF23-2D2 mice show significantly more infiltrates with **P < 0.01. K Demyelinated area relative to white matter area was quantified in cross sections of cerebellum from GF23-2D2, 2D2 and GF-IL23 mice (n = 4–5 for each group) with **P < 0.01 and showed a significant enhanced demyelination in GF23-2D2 mice

