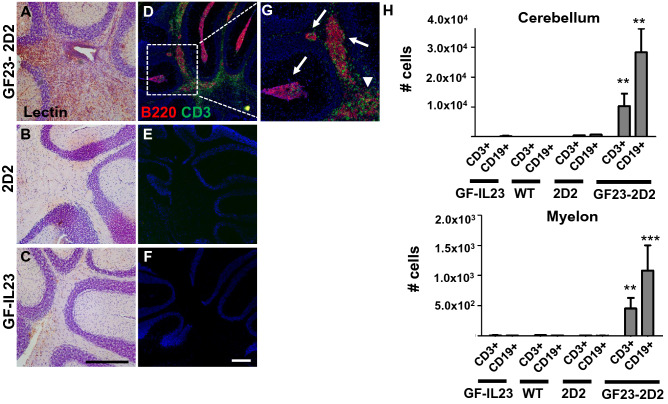
Fig. 4.
Microglia activation and B cell cluster in GF23-2D2 mice. A–C Tomato-lectin-staining exhibited activation of microglia in GF23-2D2 mice. Representative data of at least n = 4 mice of each genotype. Scale bar: 100 μm. D–F higher magnification G Fluorescent immunohistochemistry of GF23-2D2 cerebellum revealed that the infiltrates consisted of lymphocytes with a large number of B cells. There were aggregates with predominant B cell clusters (arrows) surrounded by T cells and a diffuse infiltration of T cells into the parenchyma (arrow heads). Representative data of at least n = 4–6 mice of each genotype. Scale bar: 100 μm. H Flow cytometry data showed consistent findings with predominant CD19 + cells in the spinal cord and cerebellum of GF23-2D2 mice besides CD3 + cells with *P < 0.05, **P < 0.01, and ***P < 0.001

