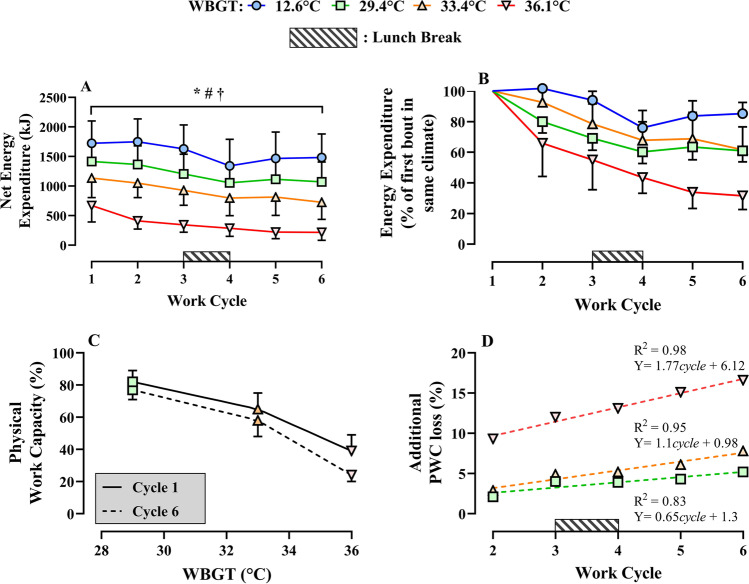
Fig. 2.
Panel A shows the absolute energy expenditure above resting, achieved in each work cycle separated by Wet-Bulb Globe Temperature (WBGT). The asterisk denotes the main effect for WBGT, the number sign denotes the main effect for work cycle, and the dagger denotes the interaction effect (all p < 0.01). Panel B shows, as a percentage, the energy expenditure achieved in each individual work cycle (W2–6) compared to the first work cycle (W1) in the same climate condition. Panel C shows the physical work capacity (PWC%) achieved relative to the PWC in the cool climate (12.6 °C WBGT) for the same work duration, assessed after 1 (solid line) or the total for 6 (dashed line) work cycles. The difference shows the extra loss over a full work shift versus a single cycle of work. Panel D shows these same differences seen in panel C, for the cumulative effect of 2 to 6 work cycles. The data in panel D were subsequently used to form correction equations, for the prediction of PWC based on the interaction between heat stress severity and work cycle duration (number of work cycles). Raw data are available in supplementary Table 1

