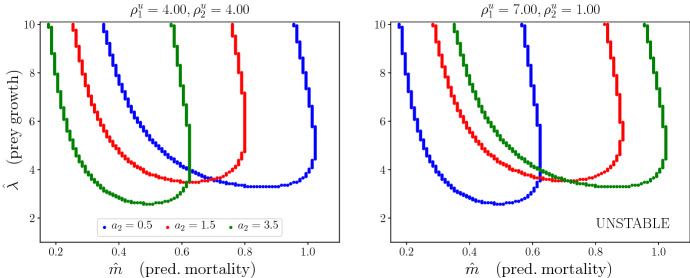
Fig. 8.
The effect of varying the attack rate on patch type 2 (, coloured curves) in the stability boundaries for different combinations of prey residence index (). Plots with respect to per capita prey growth rate () and the per capita predator mortality rate (), when the system is close to the Hopf bifurcation (when C is close to ). The areas above the curves correspond to regions of parameters where the PTW solutions are stable, whereas the areas below the curves correspond to regions where the solutions are unstable. and ; hence, and do not depend on . The other parameters are (Color Figure Online)

