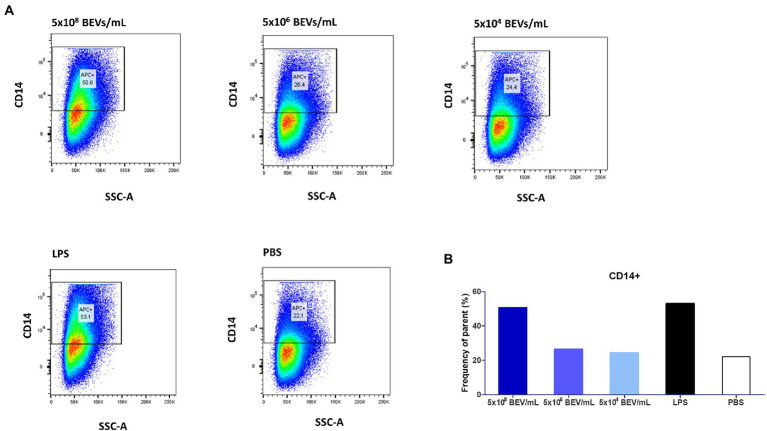
Figure 4.
Bt BEVs elicit phenotypic changes in THP1-Blue NF-κB cells (106 cells/ml). (A) THP-1 cells were incubated with different concentrations of Bt BEVs for 24 h and analyzed for CD14 expression by flow cytometry. Gating strategy was based on scatterplots of CD14 vs. side scatter signal. (B) The bar graph represents THP-1 cells with high expression of CD14 as percentage frequency of parent.

