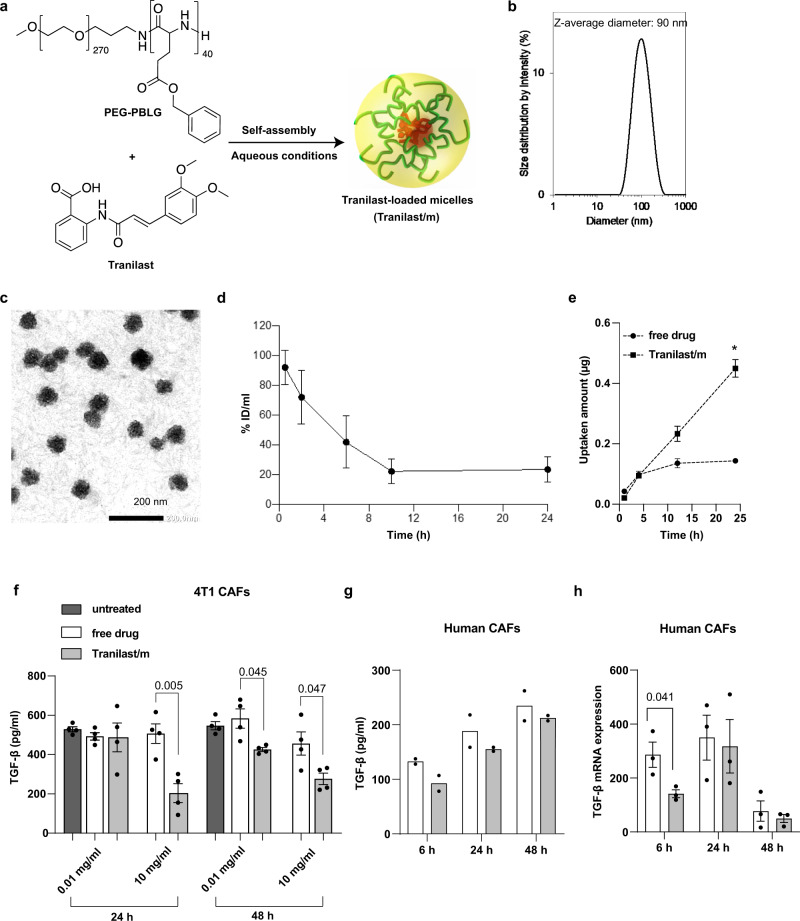
Fig. 1. Characterization of tranilast-loaded micelles.
a Schematic of tranilast-loaded micelles (Tranilast/m) preparation. The micelles were self-assembled by mixing PEG-PBLG and tranilast in aqueous conditions. b Size distribution of Tranilast/m determined by dynamic light scattering (DLS). c Transmission electron microscopy observation. d Time-dependent decay of plasma concentration after intravenous injection of 2 mg/kg Tranilast/m on tranilast basis. Data shown as the mean ± SD (n = 4 mice). e Tranilast uptake by 4T1-derived CAFs over time measured by HPLC. Data shown as the mean ± SD (n = 3 independent samples). f Quantification of TGF-β expression in conditional medium secreted by CAFs isolated from 4T1 breast tumors, following incubation with free tranilast or PEG-PBLG tranilast loaded micelles at a concentration of 0.01 and 10 mg/ml for 24 h and 48 h. Data shown as the mean ± SD (n = 8 independent samples for untreated group, n = 4 independent samples for treated group). g TGF-β1 protein concentration in conditional medium secreted by CAFs isolated from patients with lung adenocarcinoma (LUAD) (n = 2 independent samples). Data are presented as individual values and the mean. h mRNA expression levels of TGF-β by qPCR using GAPDH as the normalizing control (n = 3 independent samples). Data are presented as mean ± SE. Statistical analyses were performed by comparing the means of free drug and Tranilast/m samples using unpaired t test. TGF-β mRNA and protein was quantified following incubation with free tranilast or PEG-PBLG tranilast loaded micelles at a concentration of 0.01 mg/ml for 6, 24 and 48 h. Three replicates per sample were used and two independent experiments were performed. Data are presented as mean ± SE. Statistical analyses were performed by comparing means between two independent groups using the unpaired parametric Welch t test. Figure 1a was created with BioRender.com.

