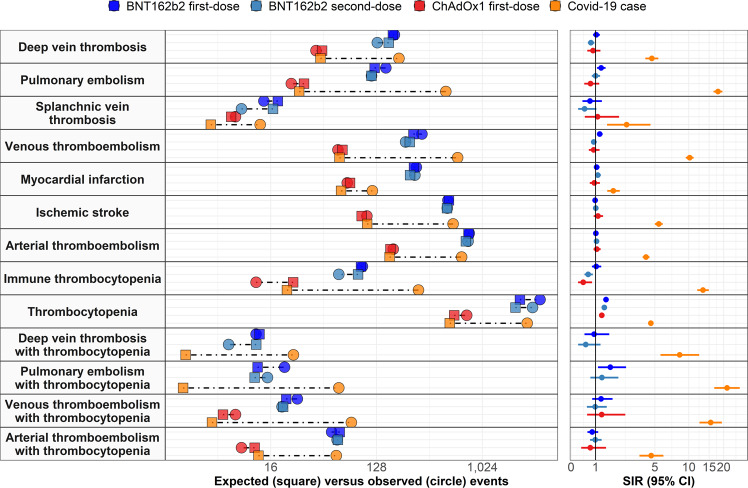
Fig. 3. Expected versus observed events among those vaccinated against SARS-CoV-2 and those with a COVID-19 diagnosis.
Expected events for each of the study cohorts based on indirect standardisation using rates from the general population between 2017 and 2019 are compared with the number of observed events seen in each cohort on the panels on the left. Corresponding standardised incidence ratios (SIRs) with 95% confidence intervals (95% CI) are shown in the panels on the right.

