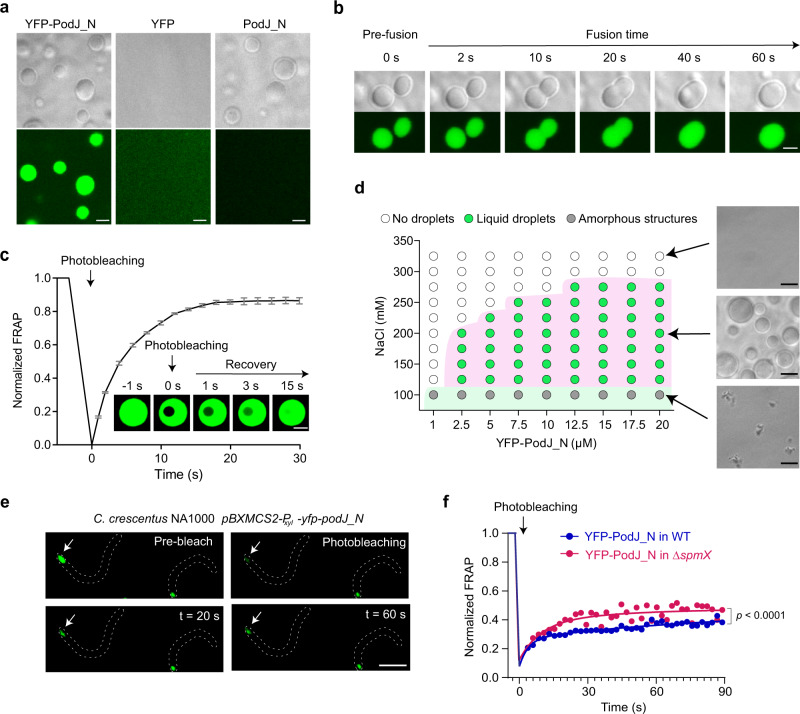
Fig. 2. PodJ undergoes phase separation both in vitro and in C. crescentus.
a The YFP-PodJ_N protein forms liquid droplets in vitro. Images were taken within 15 min after loading the ice-bathed proteins (5 µM) on a glass pad at 25 °C. YFP was used as a negative control. b The instantaneously contacted YFP-PodJ_N droplets tend to fuse together within 1 min. c FRAP analysis suggests that YFP-PodJ_N droplets are highly dynamic. The recovery curve was generated by averaging the signals of YFP-PodJ_N droplets (n = 6) from three independent experiments. One representative droplet is shown. The fluorescence intensity of pre-bleached droplets was normalized as 100%. Data are means ± SEM. d A regime diagram illustrates the formation of YFP-PodJ_N droplets at different protein and salt concentrations. Representative images are shown on the right panel. e FRAP analysis of YFP-PodJ_N condensates in C. crescentus wild-type and ΔspmX cells. The expression of YFP-PodJ_N was driven by the PxylX promoter from a high copy plasmid to achieve FRAP analysis. One representative bleached focus (white arrow) in the wild-type cell is shown. f Quantification of the FRAP analyses in panel e. The recovery curves for each sample were generated by averaging the signals of YFP-PodJ_N foci (n = 6) from three independent experiments with nonlinear regression. The fluorescence intensity of pre-bleached foci was normalized as 100%. Data are means ± SEM and p value was determined by two-tailed Welch’s unpaired t-test. All scale bars, 2 μm. Source data are provided in the Source Data file.

