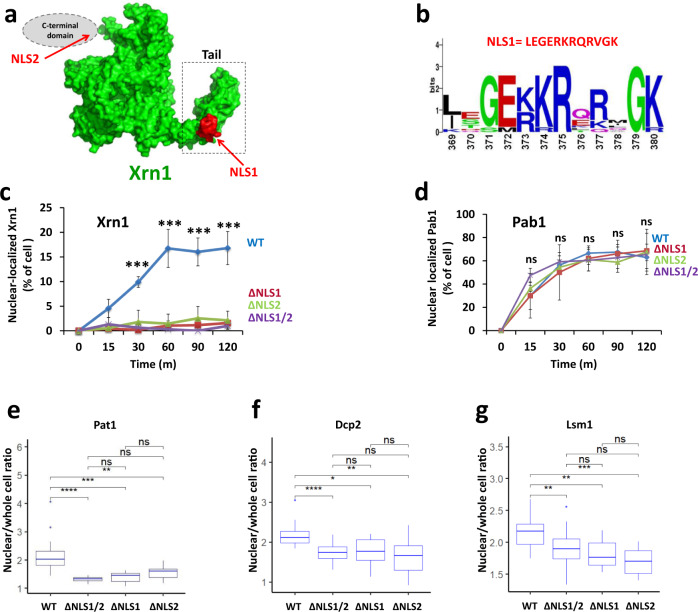
Fig. 1. Xrn1 contains two functional NLSs.
a Position of NLSs. NLS1, found by cNLSmapper18–20, is highlighted in red. Xrn1 structure was modelled using SWISS-MODEL63. Tail is indicated by a dashed box. The expected location of the unstructured C-terminal domain containing NLS2 is shown schematically as a grey ellipse. b Sequence conservation of NLS1 among different yeast species. The sequences of 11 yeast strains were compared by the online WebLogo (U. Berkeley). The height of each stack of letters represents the degree of sequence conservation, measured in bits. c Xrn1-GFP import kinetics. A standard import assay was performed, as described in Methods, using cells that co-expressed Pab1-RFP (served as positive control, see d) and Xrn1-GFP or its mutant derivatives, as indicated. Percentage of cells showing nuclear import was measured at the indicated time intervals after inactivation of protein export. n = >100 cells examined over 3 independent experiments. Error bars represent standard deviation (S.D.) p-values of two-tailed t-tests between WT and each of the NLS-mutant are indicated as *** <0.001 for all the pairs. d Import of Pab1, used as a positive control. Error bars in c and d represent standard deviation (S.D.) of three independent assays. e–g Starvation-induced nuclear localization of the indicated fluorescent DFs is dependent on Xrn1 NLSs. The mean fluorescence intensity of the nucleus and whole cell of WT or NLS mutant cells expressing the indicated RFP fused DF were measured after 1 h starvation in medium lacking sugar and amino acids. Each box represents the 25th to 75th percentile of values, with the median noted by the horizontal bar. Whiskers terminate at maxima/minima or a distance of 1.5 times the IQR away from the upper/lower quartile, whichever is closer. n = >300 cells examined over 3 independent experiments. The ratio between the nuclear and whole-cell fluorescence is shown as a boxplot. P value was calculated by Wilcoxon rank sum test. * - <0.05; **- <0.01; *** - >0.001; **** - <0.00001; ns – not significant.

