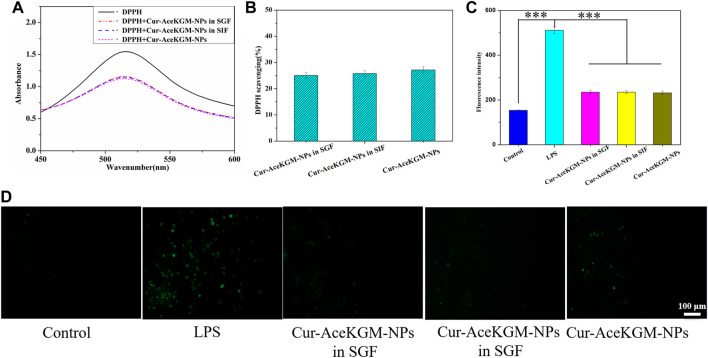
FIGURE 4.
(A) UV−vis spectra of blank DPPH, DPPH + Cur–AceKGM NPs in SGF, DPPH + Cur–AceKGM NPs in SIF, and Cur–AceKGM NPs. (B) DPPH scavenging effect of the Cur–AceKGM NPs. (C) Fluorescence intensity of DCFDA in RAW264.7 cells with different treatments. (D) Fluorescence microscopy images of RAW264.7 cells with different treatments, green: ROS. All the experiments were performed in triplicate, scale bar = 100 μm, and data are shown as the mean ± SD. ***p < 0.001.

