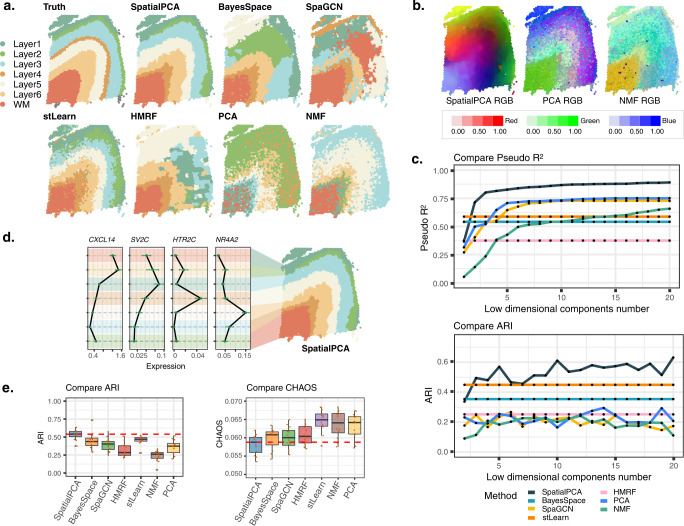
Fig. 2. Analysis of the cortex data from DLPFC.
a Clustering of tissue locations based on SpatialPCA, BayesSpace, SpaGCN, stLearn, HMRF, PCA, and NMF. Ground truth of tissue regions on sample 151676 of the human prefrontal cortex are annotated by the original DLPFC study. b For SpatialPCA, PCA, and NMF, we summarized the inferred low-dimensional components into three UMAP components and visualized the three resulting components with red/green/blue (RGB) colors through the RGB plot. Color code corresponds to the RGB values of each location’s three UMAP components inferred from low-dimensional components in dimension reduction. Different colors indicate different values for each of the three UMAP components on the tissue section, highlighting the difference of the low-dimensional components from different methods included in the panel. c Upper panel: spatial PCs in SpatialPCA have higher prediction accuracy for the ground truth of tissue regions in terms of McFadden’s pseudo-R2 than latent components from PCA, NMF, and SpaGCN. For BayesSpace and HMRF, we treated their inferred cluster labels as the predictors. Lower panel: spatial PCs in SpatialPCA have higher clustering accuracy for the ground truth of tissue regions in terms of ARI. d Mean expression of layer-specific markers including layer 2 marker gene CXCL14, layer 3 marker gene SV2C, layer 5 marker gene HTR2C, and layer 6/6b marker gene NR4A2 (n = 3460 spots). The cluster labels correspond to the labels of SpatialPCA detected spatial domains in (a). In the boxplot, the center line denotes the mean value of the expression. e Left: clustering accuracy of different methods in recapitulating the true tissue domains. Accuracy is measured by the adjusted Rand index (ARI) in all 12 sections. For BayesSpace, SpaGCN, and HMRF, clustering was performed based on their default settings. For dimension reduction methods (PCA and NMF), clustering was performed based on the inferred low-dimensional components on spatially variable genes. Right: clustering performance of different methods in obtaining smooth and continuous spatial domains measured by spatial chaos score (CHAOS) in all 12 sections. Lower CHAOS score indicates better spatial continuity of the detected spatial domains. In the boxplot, the center line, box limits and whiskers denote the median, upper, and lower quartiles, and 1.5× interquartile range, respectively.

