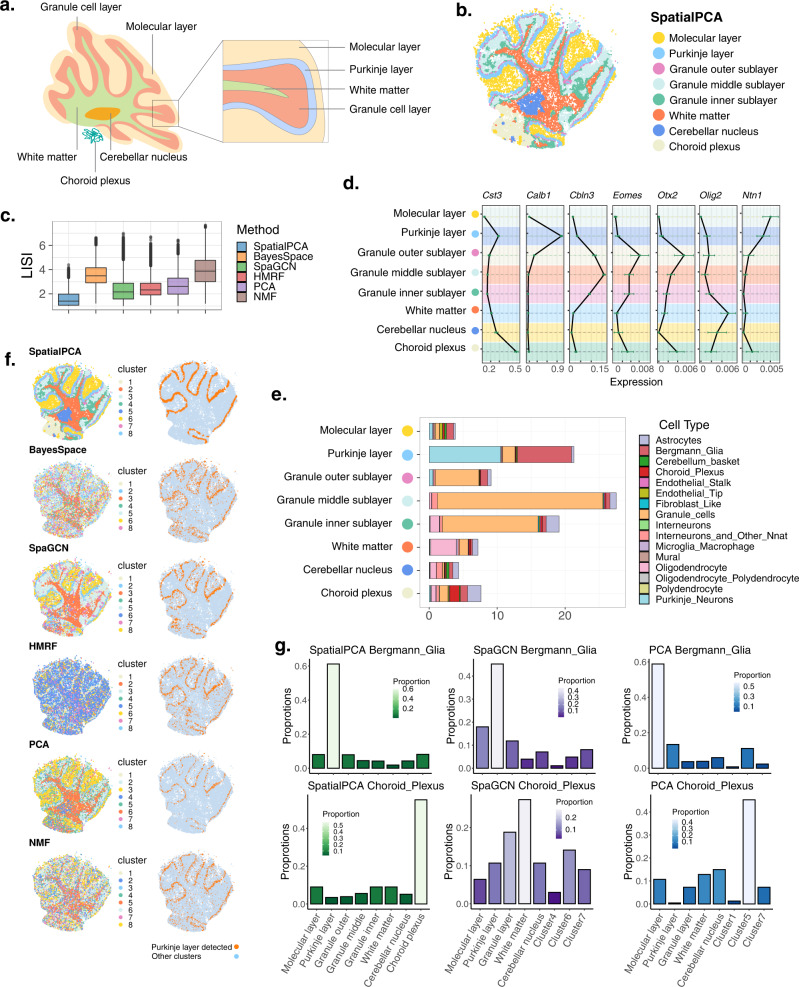
Fig. 3. Analysis of the cerebellum data from Slide-seq.
a The structure of the mouse cerebellum cortex, with the main tissue regions annotated. b Clustering on the low-dimensional components inferred by SpatialPCA segregates tissue locations into distinct tissue regions. The detected tissue regions were annotated based on their relative positions on the tissue and the enriched cell types in each detected tissue domain. c Clustering performance of different methods in obtaining smooth and continuous spatial domains measured by local inverse Simpson’s index (LISI) in 20,982 locations. Lower LISI score indicates more homogeneous neighborhood spatial domain clusters of a spot. In the boxplot, the center line, box limits and whiskers denote the median, upper and lower quartiles, and 1.5× interquartile range, respectively. d Mean expression of regional marker genes in the cerebellum (n = 20,982 locations). The cluster labels correspond to the labels of SpatialPCA regions in (b). In the boxplot, the center line denotes the mean value of the expression. e Percentage of different cell types (x axis) in each tissue domain detected by SpatialPCA (y axis). f SpatialPCA correctly depicts the Purkinje layer. Left: tissue location clustering results using different methods; different color represents different location clusters. Right: the Purkinje layer detected by different methods is highlighted in orange, and the background is colored in light blue. For spatial clustering methods (BayesSpace, SpaGCN, and HMRF), location clusters were inferred using the software. For dimension reduction methods (PCA and NMF), clustering was performed based on the inferred low-dimensional components after dimension reduction using spatially variable genes. g Distribution of Bergmann glia cells and choroid plexus cells in each cluster for different methods. The summation of the cell-type percentages in all clusters is 100% for each method.

