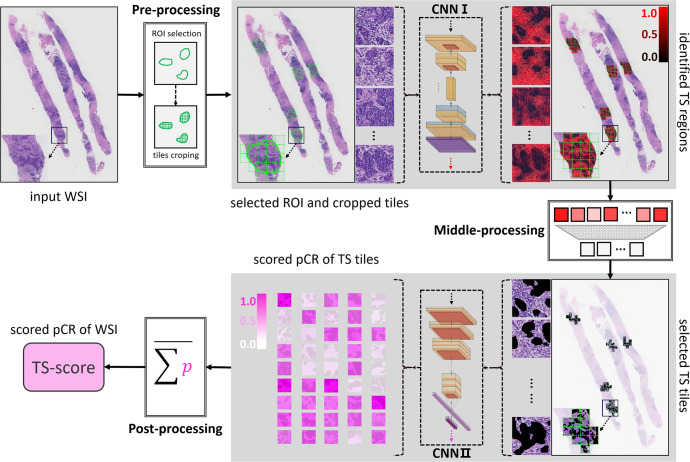
Fig. 2. Image processing pipeline to develop a stromal-derived biomarker for predicting pCR.
In the pre-processing step, the digitized HE-stained slides were manually annotated and the ROIs were cropped as tiles (256 × 256 pixels at 10 × magnification). With processed by the CNN I (also referring the E-S classifier), stromal pixels within the ROIs were detected and highlighted in red, and the color, red to black, indicates the probability of stroma from high to low. In the middle-processing step, a well-trained observer reviewed all tiles and removed the stromal tiles that did not exactly matched with the ground truth. Stroma tiles with identified by both the CNN I and the human observer were delivered to the CNN II and each tile was assigned with a score indicating the risk of achieving a pCR. In the post-processing step, all tile-level scores of each WSI were summed and the mean value was calculated and named TS-score, which was deemed as a DL-based biomarker derived from the stromal compartment and reflected the risk of pCR for breast cancer.

