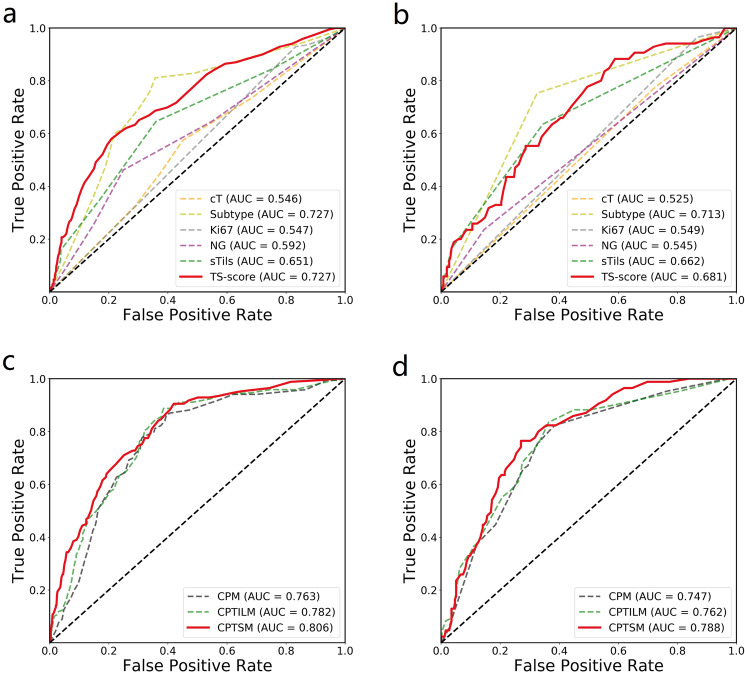
Fig. 4. ROC curves of the marker-based models.
The top row shows the performance of the single marker-based models for predicting pCR in the primary cohort (a) and the three external validations (b). The bottom row shows the performance of the baseline marker-based model (CPM), the baseline marker and sTILs-based model (CPTILM), and the baseline marker and TS-score-based model (CPTSM) for predicting pCR in three three external validations (c, d).

