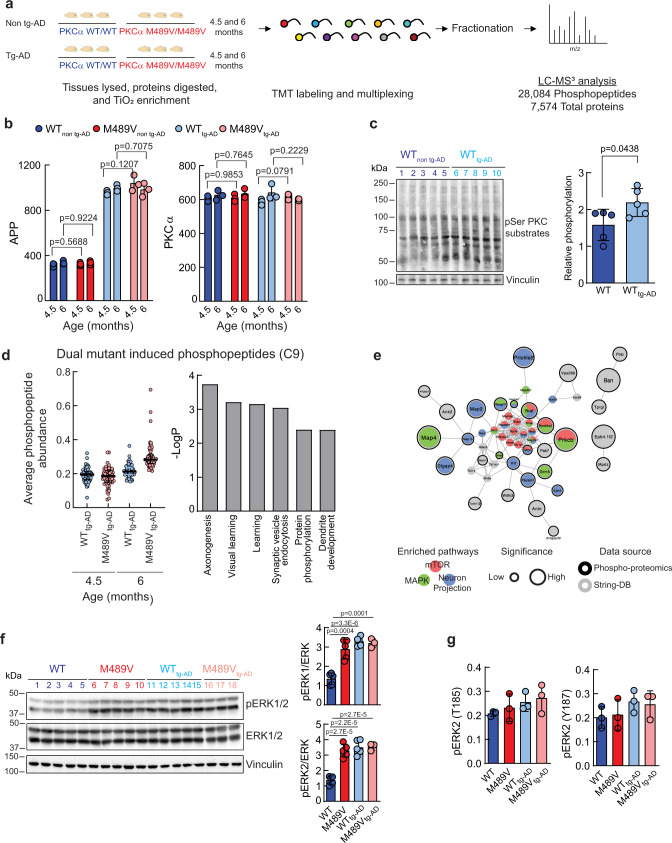
Fig. 5. Phosphoproteomics analysis of brains from WT mice and mice harboring the PKCα M489V mutation (red) on a B6;SJL background with the APP transgene carrying the Swedish mutation (APPswe).
a Experimental design. Brains from WT (blue) or homozygous (red) mice with or without the APPswe transgene at 4.5 and 6 months of age were subjected to phosphoproteomics analysis. 7574 proteins and 28,084 phosphopeptides were quantified in the standard proteomics and phosphoproteomics analyses, respectively. b Graphs showing the abundance of APP (left) and PKCα (right) detected in the proteomic analysis across all samples. Graphs depicts the mean ± SD (p values obtained using a two-tailed Student’s t test, n = 3 biologically independent samples). c Left. Immunoblot of brain lysates obtained from WT non tg-AD mice (lanes 1–5, dark blue) and tg-AD mice (lanes 6–10, light blue). Right. Relative phosphorylation represents the quantification of PKC substrates phosphor-signal normalized to vinculin. Normalized data from the depicted western blot were plotted as average normalized intensity ± SEM (p = 0.0438, using a two-tailed Student’s t test). d Left: graph showing the distribution of phosphopeptides from C9 Graph depicts the median± interquartile range (values of p < 0.05 using a two-tailed Student’s t test, n = 3 biological independent samples). Right. GO enrichment analysis of C9 peptides using DAVID. e STRING analysis of proteins whose phosphopeptides were present in C9. Red represents proteins in the mTOR signaling pathway, green in the MAPK signaling pathway and blue represents proteins involved in neuron projection. f Left. Immunoblot of pERK1/2 (T202/Y204 for ERK1 and T185/Y187 for ERK2) and total ERK1/2 in brain lysates obtained from WT non-tg-AD (WT), M489V non tg-AD (M489V), WT tg-AD and M489V tg-AD mice at 6 months. Right. ERK1 (top) or ERK2 (bottom) phosphorylation reflects the normalized phospho-signal relative to total ERK. Data represent the average normalized intensity ± SEM (ANOVA was used for statistical analysis, followed by post hoc two-tailed Student’s t test). g Quantification of ERK phosphopeptides detected by phosphoproteomics in 6-month-old samples (mean ± SD). Source data and uncropped blots for c and f are in the Source Data file.

