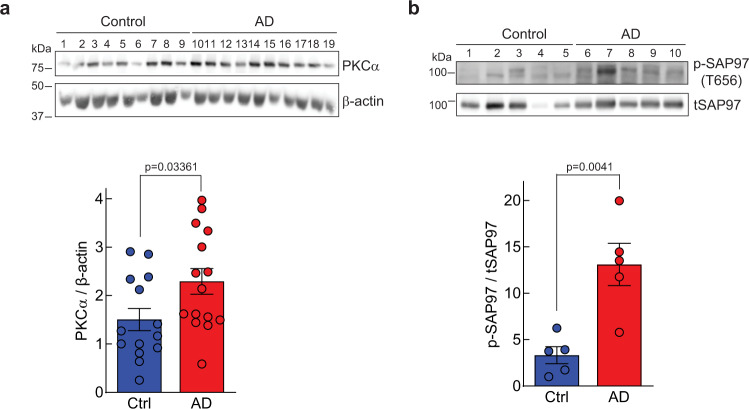
Fig. 7. PKCα levels and phosphorylation of SAP97 is increased in the frontal cortex of patients with Alzheimer’s disease.
a Western blot of lysates of frontal cortex obtained from nine brains (lanes 1–4, females; lanes 5–9, males) from control patients and nine brains (lanes 10–14, females; lanes 15–19, males) from AD patients. Western blots were probed with antibodies specific to total PKCα (top) and β-actin (bottom) as loading control. Graph depicts the quantification of the data in the western blot, including an additional 5 samples of each condition. b Western blot of lysates of frontal cortex obtained from five brains (lanes 1–2, males; lanes 3–5, females) from control patients and five brains (lanes 6–7, males; lanes 8–10, females) from AD patients. Western blots were probed with antibodies specific to a known PKC phosphorylation site on SAP97 (Thr656) (Top) or to total SAP97 (Bottom). Graph depicts the quantification of the data in the western blot. a, b Bands were quantified using densitometry and the phospho-SAP97 signal was normalized to total SAP97 signal and PKCα signal was normalized to its β-actin loading control. Normalized data from the depicted western blots were plotted (Bottom) as average normalized intensity ± SEM (p values were determined using unpaired two-tailed Student’s t test). Source data and uncropped blots for figures a and b are in the Source Data file.

