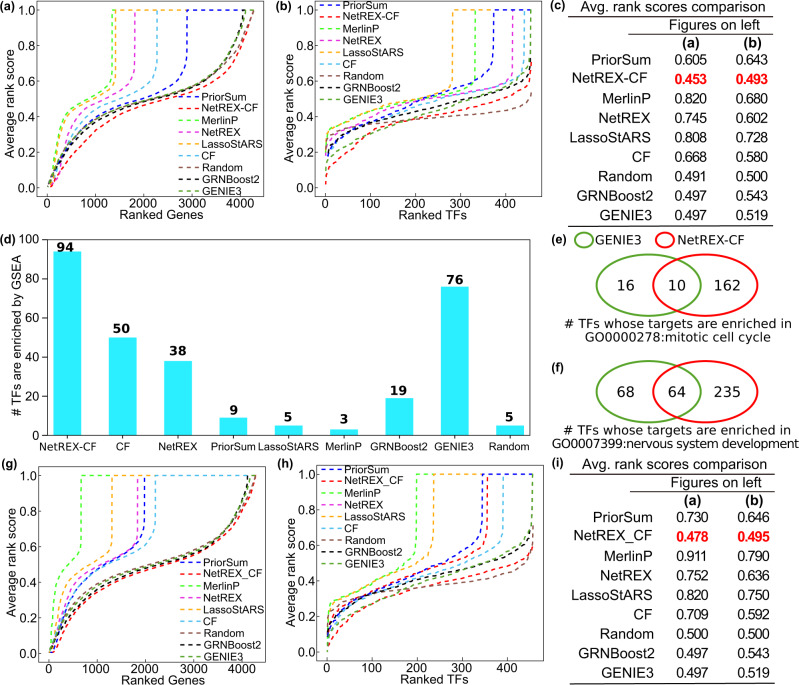
Fig. 4. Performance comparison for all competing algorithms on the S2 cell line.
a The performance of the methods on the task of predicting regulating TFs: for each algorithm, we compute for each gene the rankings of edges in the benchmark dataset adjacent to it, sort them in descending order, and plot the sorted average rankings. b The performance of the methods on the task of predicting regulated genes using a measure similar to in (a) but focusing on genes regulated by TFs. c Summary of the average rank scores in (a) and (b). The lowest scores are highlighted in bold red. d The bar plot indicates the number TFs whose target genes in the benchmark dataset are significantly enriched at the top of the ranked gene list (p value < 0.01 with 1000 random permutations), as predicted by each method in the GSEA analysis. e, f The Venn diagram between TFs is identified by the top two methods in (b): GENIE3 and NetREX-CF. The target genes of TFs shown in are enriched in the GO term of the mitotic cell cycle (e) and nervous system development (f), respectively. g–i The same plots as (a) and (b). The only difference is that all the competing methods do not use the ChIP prior.

