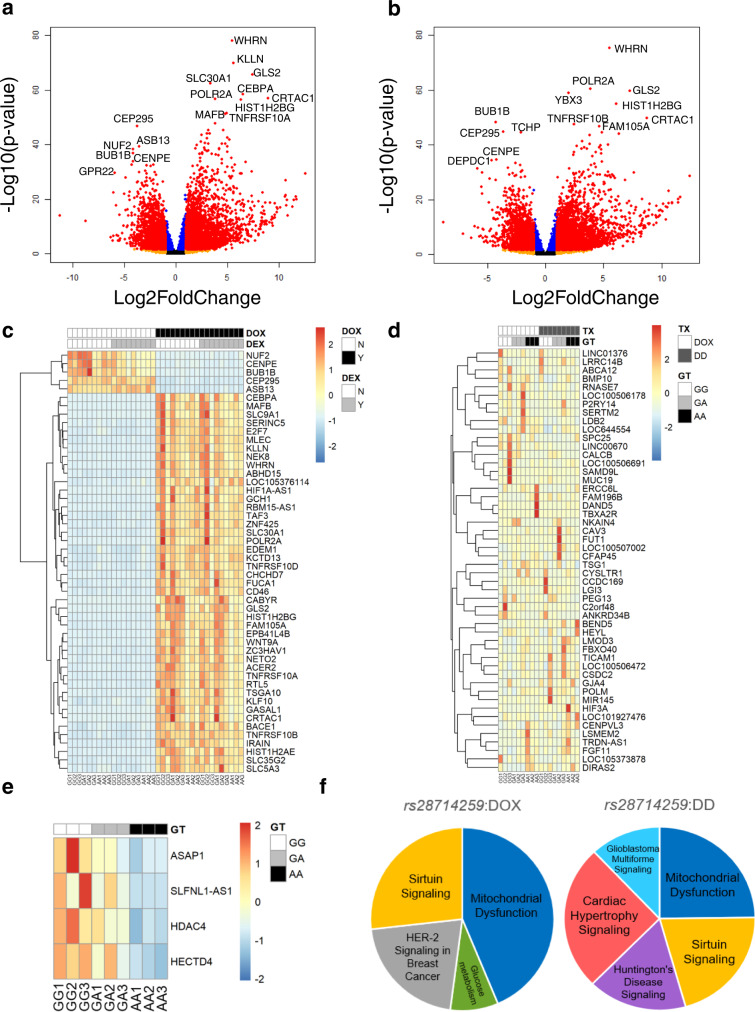
Fig. 5. Transcriptomic changes induced by doxorubicin and dexamethasone/doxorubicin combination treatment and genes/pathways impacted by the rs28714259 risk (A) allele.
a, b Volcano plots representation of differential gene expression pattern induced by doxorubicin-only (a) or dexamethasone/doxorubicin combination treatment (b) over vehicle-treated control in nine rs28714259 intrinsically polymorphic hiPSC-derived cardiomyocyte cell (hiPSC-CM) lines. Tests for differential expression were performed with DESeq2 package in R using a negative binomial generalized linear model (two-sided test). The p-values were then corrected for multiple hypothesis testing using the False Discovery rate (FDR) approach of Benjamini–Hochberg. An FDR < 0.05 were considered statistically significant. Significantly differentially expressed genes (FDR < 0.05) of Log2 Fold Change (|log2FC|) > 1 are highlighted in red, while those of |log2FC| < 1 are highlighted in blue. Black and orange highlights represent genes with FDR > 0.05. Top differentially expressed genes are labeled. c Heat map of gene expression patterns in vehicle control, dexamethasone-only, doxorubicin-only, and dexamethasone/doxorubicin combination treatment groups. Top 50 genes most differentially regulated by doxorubicin treatment (|Log2FC > 1|, ranked by P-value) are shown. d Heat map of top 50 most differentially regulated genes between doxorubicin-only and dexamethasone/doxorubicin combination treatments based on ΔLog2FC in nine rs28714259 intrinsically polymorphic hiPSC-CM lines. e Heat map of differential gene expression induced by dexamethasone/doxorubicin combination treatment significantly impacted by the risk (A) allele. Differential gene expression after treatment for each sample was normalized to its baseline (control) expression (d, e). f Top pathways differentially regulated by the risk (A) allele following doxorubicin or dexamethasone and doxorubicin combination treatment identified by IPA. Benjamini-Hochberg (B-H) adjusted p-values were calculated in IPA to account for multiple comparisons, and the B-H adjusted p-value < 0.05 was considered as statistically significant. Percentage of pie chart is proportional to the number of genes identified in each pathway. Pathways are ordered clockwise by P-value. TX treatment, GT genotype, DOX doxorubicin, DD dexamethasone/doxorubicin combination. Source data for Fig. 5a–f are provided as a Source Data file.

