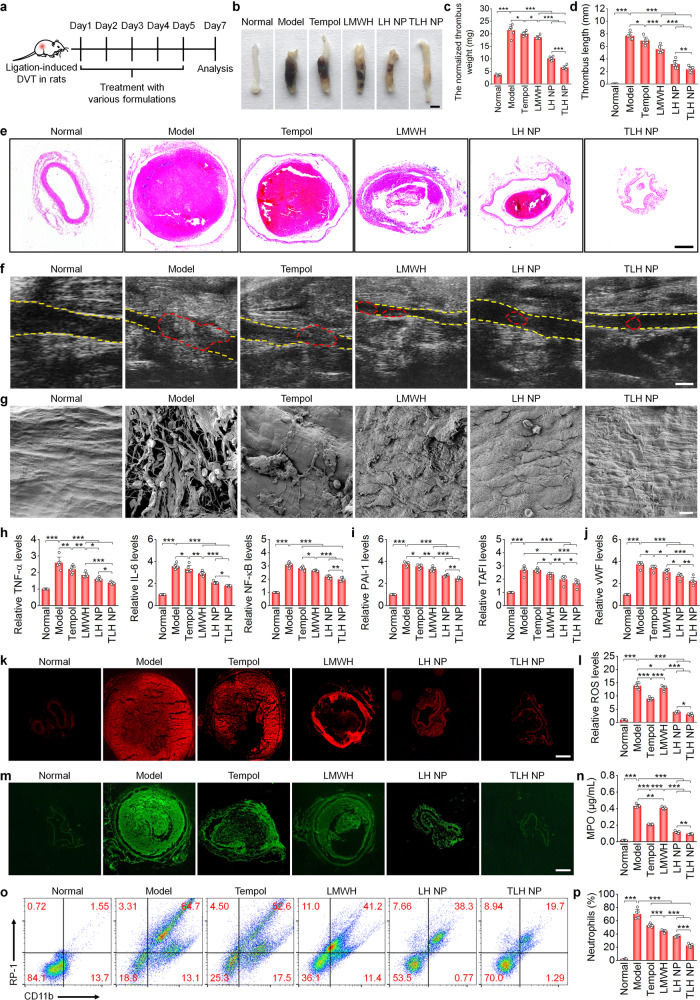
Fig. 4. Therapeutic effects of LH NP and TLH NP in pregnant rats with stenosis-induced DVT.
a Schematic illustration of the treatment regimens. b Representative digital photos of left iliac veins with thrombi isolated from pregnant rats after treatment with different formulations. Scale bar, 1 mm. c, d The normalized weight (c) and length (d) of thrombi in left iliac veins after different treatments. e H&E-stained histopathological sections of left iliac veins with thrombi. Scale bar, 400 μm. f Ultrasound images of left iliac veins. The yellow dashed lines indicate the vascular endothelium, while the red dashed lines indicate thrombi. Scale bar, 1 mm. g SEM observation of the endothelial surface of left iliac veins with thrombi and after different treatments. Scale bar, 10 μm. h–j Relative mRNA levels of TNF-α, IL-6, NF-κB, PAI-1, TAFI, and vWF in left iliac veins. k, l Fluorescence images of DHE-stained cryosections (k) and quantitative analysis of relative ROS levels (l) in left iliac veins. Scale bar, 400 μm. m, n Immunofluorescence images showing MPO-positive neutrophils in cryosections (m) and quantified MPO levels (n) in left iliac veins. Scale bar, 400 μm. o, p Representative flow cytometric profiles (o) and quantified levels (p) of CD11b+/RP-1+ neutrophils in left iliac veins. In all these studies, left iliac veins of pregnant rats at G10 were ligated to induce DVT. At 6 h after the formation of stenosis-induced thrombi, diseased rats were daily administered with saline (the model group), free Tempol (8 mg/kg, i.v.), free LMWH (5 mg/kg, s.c.), LH NP (at 5 mg/kg of LMWH, i.v.), or TLH NP (at 5 mg/kg of LMWH, i.v.) for 5 days. In the normal group, healthy pregnant rats with sham operation were treated with saline. Data in b, e–g, k, m, o are representative of six independent samples. Data in c, d, h–j, l, n, p are mean ± s.d. (n = 6 independent samples). Statistical significance was assessed by one-way ANOVA with post hoc LSD tests. *p < 0.05, **p < 0.01, ***p < 0.001. Source data are provided as a Source Data file.

