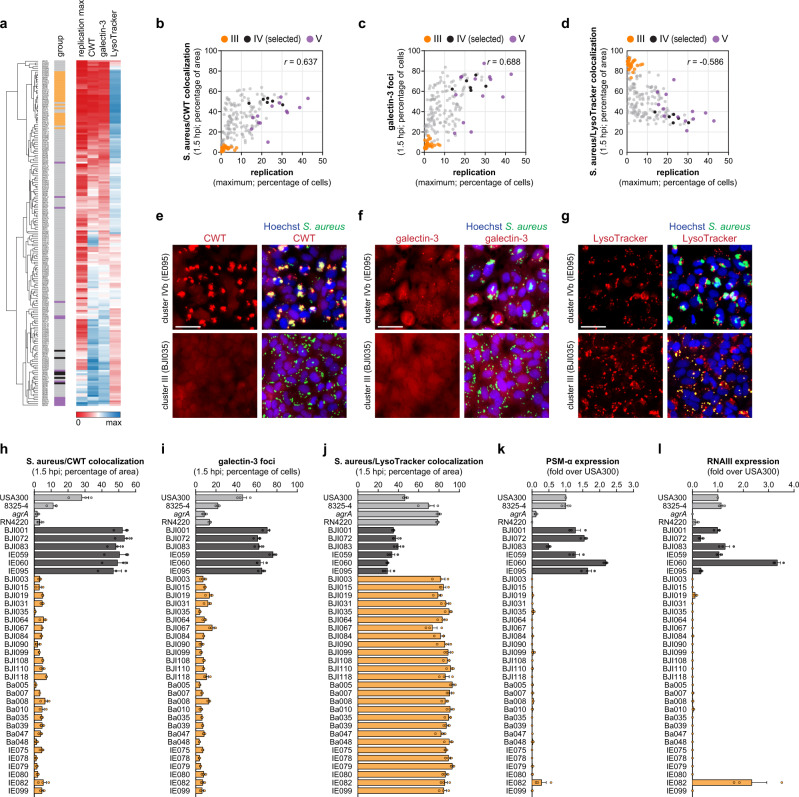
Fig. 5. S. aureus isolates presenting low vacuolar escape and intracellular replication upon infection of non-phagocytic host cells are agr system defective.
a Heat map showing the percentage of cells with high S. aureus intracellular replication (maximum value), percentage of S. aureus/CWT colocalization (at 1.5 hpi), percentage of infected cells positive for galectin-3 foci (at 1.5 hpi), and percentage of S. aureus/LysoTracker colocalization (at 1.5 hpi), for epithelial cells (HeLa) infected with the 191 S. aureus isolates. The results shown are the mean of three biologically independent experiments. Hierarchical clustering was performed based on Euclidean distance. Group III and V bacterial isolates are highlighted in orange and purple, respectively; six selected isolates showing high replication and high host cell death (selected from clusters IVa, IVb, IVc) are highlighted in black; all the other isolates are shown in light gray. b–d Pairwise comparison of S. aureus intracellular replication with S. aureus/CWT colocalization (b), or infected cells positive for galectin-3 foci (c), or S. aureus/lysotracker colocalization (d). The 191 S. aureus isolates are color-coded as described in panel a. Spearman’s rank correlation coefficients are shown in the upper right corner of each graph. e–g Representative fluorescence microscopy images of HeLa cells infected with S. aureus isolates belonging to cluster III (BJI035) and IVb (IE095), to evaluate the recruitment of fluorescently-labeled CWT (e), formation of galectin-3 foci (f), and colocalization with LysoTracker (g). Microscopy images are representative of three biologically independent experiments and correspond to 1.5 hpi. Scale bar, 50 µm. h–j Quantification of the percentages of S. aureus/CWT colocalization (h), infected cells positive for galectin-3 foci (i), S. aureus/LysoTracker colocalization (j), for HeLa cells infected with S. aureus isolates belonging to cluster III (orange), six isolates selected from clusters IVa, IVb, IVc (black), and four control S. aureus strains (USA300, 8325-4, agrA mutant, RN4220; light gray). All results correspond to 1.5 hpi and are shown as mean ± s.e.m of three biologically independent experiments. k, l. Expression levels of PSM-α (k) and RNAIII (l) determined by qRT-PCR in bacterial cultures corresponding to the S. aureus isolates described in panels h–j Results are shown normalized to S. aureus USA300, and presented as mean ± s.e.m of three biologically independent experiments. Source data are provided as a Source Data file.

