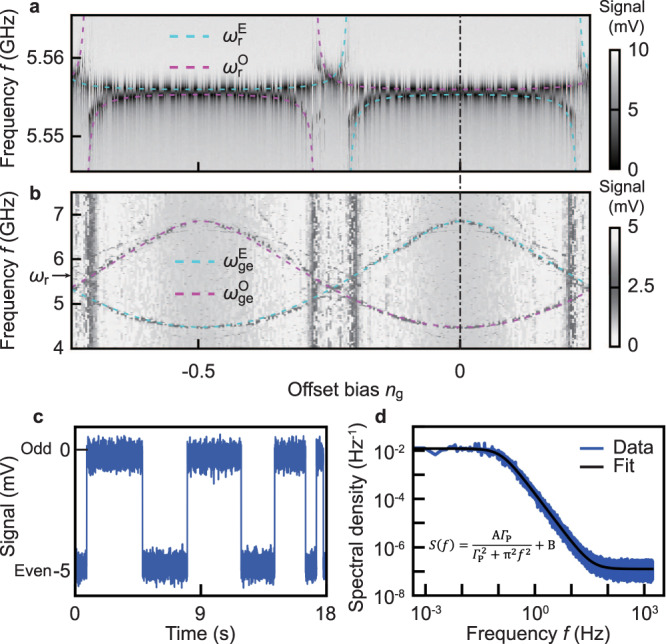
Fig. 2. Spectroscopy and charge-parity detection.

a Resonator (ωr) and b qubit spectroscopy as a function of the offset charge bias ng, showing 2e periodicity and a shift of 1e between even and odd parity. The dashed lines are the identified resonator frequency and the g-e transition frequency of the qubit (the superscript letter E and O indicate even and odd parity, respectively) from fitting to the Jaynes-Cumming model. The resonator spectrum was acquired by a network analyzer at a rate of 0.2 s per offset bias or vertical linecut, while the qubit spectrum was obtained from pulsed measurements with each data point taking ~0.1 s. See Supplementary Note 3 (Supplementary Material) for the other identified transitions. c Example of the time evolution (time interval: 0.3 ms; total length 18 s) of the charge parity measured at ng = 0 showing random telegraph behaviour between even (P = 1) and odd (P = − 1) parity. d Power spectrum of the charge-parity fluctuations obtained from 1200 repetitions of the measurement in c. The inset shows the Lorentzian fitting function, where ΓP (the average switching rate), A and B are fitting parameters. In the illustrated case, the extracted charge-parity lifetime TP = 1/ΓP = 2.7s. The white noise (offset term B) is due to the sampling noise.
