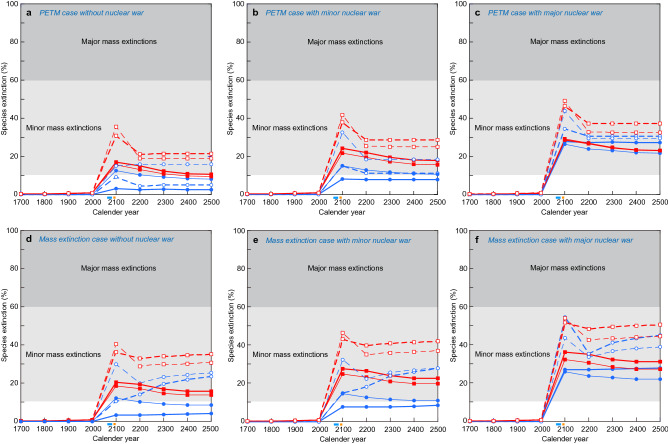
Figure 4.
Animal species extinction percentages in the marine (blue circle) and terrestrial (red square) realms from CE 1700 to 2500 by all causes without nuclear war in the PETM case (a), those under minor nuclear war in the PETM case (b), those under major nuclear war in the PETM case (c), those without nuclear war in the mass extinction case (d), those under minor nuclear war in the mass extinction case (e), those under major nuclear war in the mass extinction case (f), in the most likely case (solid lines with closed dots) and the worst case (dushed lines with open dots). Thick lines: different contribution case. Thin lines: equal contribution case. The light blue and orange bars under the horizontal axes show the timing of the stoppage of GHG emissions in the most likely case and in the worst case, respectively. The maximum values of species extinction (%) correspond to the final species extinction magnitude. These data are shown in Supplementary Tables S5–S8. The maximum extinction magnitude occurred in ~ 2100 CE under no nuclear war case.

