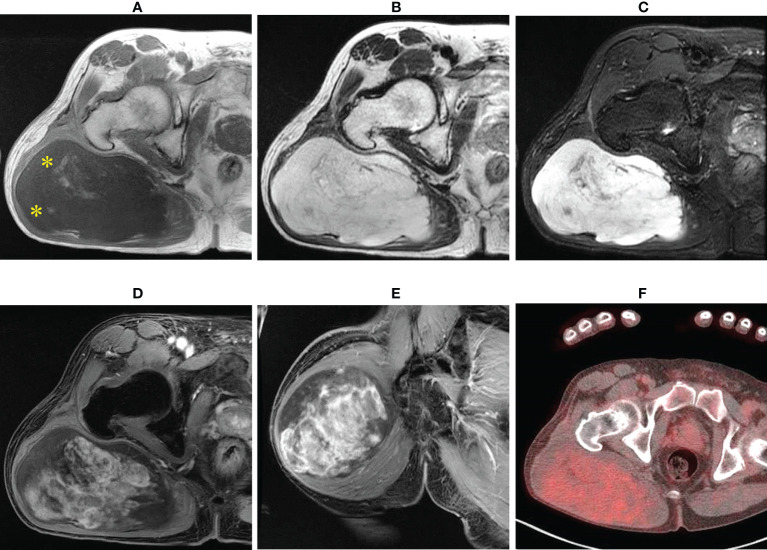
Figure 1.
Imaging findings. T1-weighted axial images showing low and slightly high signals (yellow asterisk) (A); almost homogeneous high signal on T2-weighted images (B) and short tau inversion recovery images (C); and axial and central enhancement on a gadolinium-enhanced T1-weighted axial image (D, E). Axial fluorodeoxyglucose (FDG) positron emission tomography-computed tomography (PET-CT) showing a hypometabolic tumor (F).

