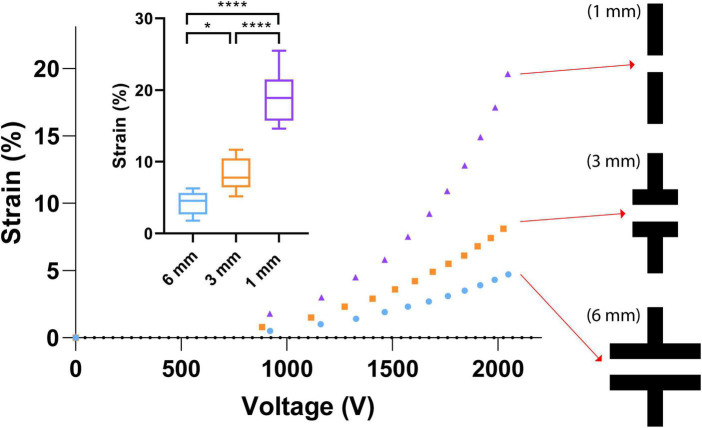
FIGURE 5.
Electrode geometry effects. Small graph—the strain capabilities of each electrode design with an applied voltage of 2,000 V. A total of 45 CIDs were tested to produce the illustrated boxplots that display the effect of the electrode design on strain. The stars and quantity illustrate statistical significance and level of significant difference, respectively. The Brown Forsythe and Welch ANOVA test was used as there were more than two group samples and there was heterogeneity of variance between these groups (*P = 0.038, ****P < 0.001). Large graph—Three different electrode designs at the center of our CIDs were investigated in this study. The three designs are 6, 3, and 1 mm in width, which consistently produce 4, 8, and 20% strains, respectively, with an applied voltage of 2,000 V. This was a safe voltage that enables the device to survive the stretching tests without dielectric breakdown. In air, these devices can be function at much higher voltages, but the presence of cell culture media on the topside of the membrane limits the voltage range during testing.

