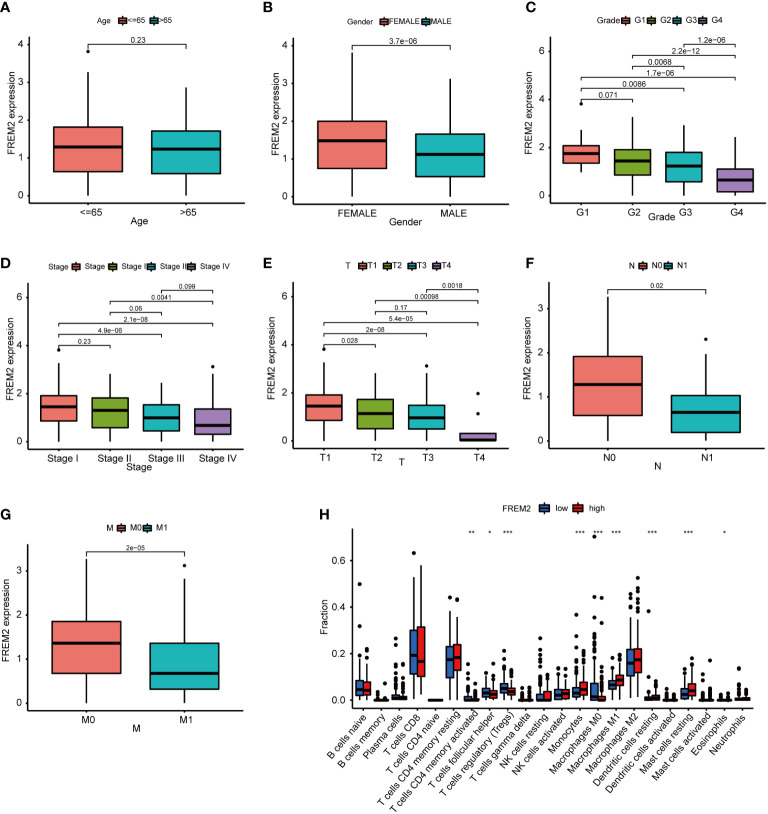
Figure 10.
The relationship between FREM2 expression level and pathological features, as well as immune cell in patients with high and low FREM2 mRNA expression. (A–G). The relationship of FREM2 expression level and clinicopathological features. (H) The relative proportion of immune cells using ssGSEA in patients with high and low FREM2 mRNA expression. *p< 0.05, **p< 0.01, and ***p< 0.001.

