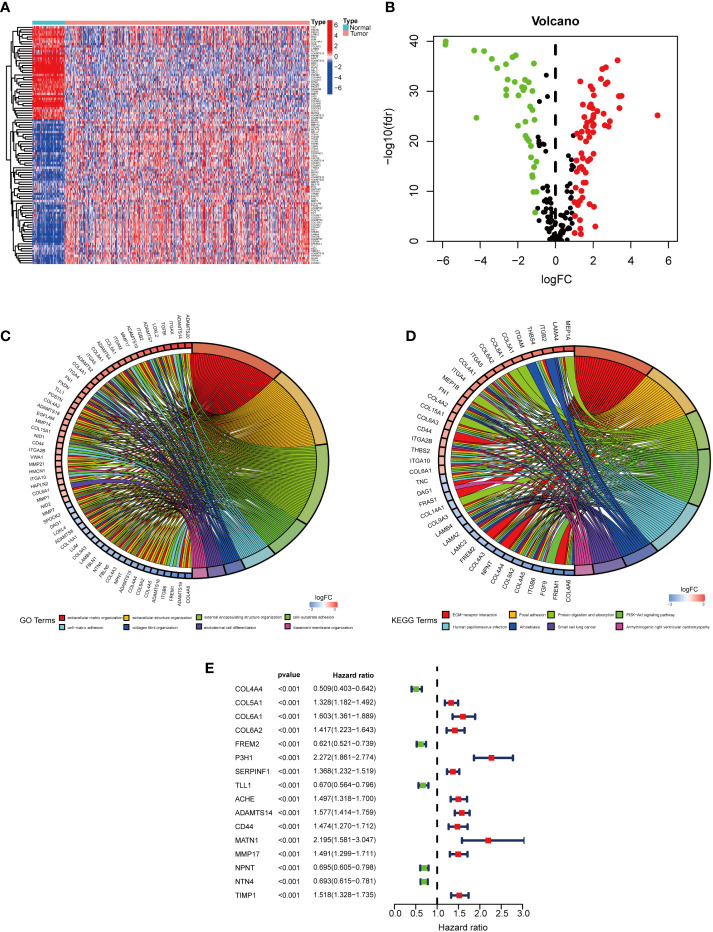
Figure 2.
Differentially expressed BMGs in KIRC cases. (A) Enrichment plot of 106 BMGs in normal and tumor tissues. (B) The volcano plot of 106 differentially expressed BMGs with differential expression. (C, D). Noticeable enrichment of GO terms and KEGG pathways of 106 BMGs. (E) The forest plot illustrated a uni-Cox-reg analysis of the association of 16 BMGs with prognosis.

