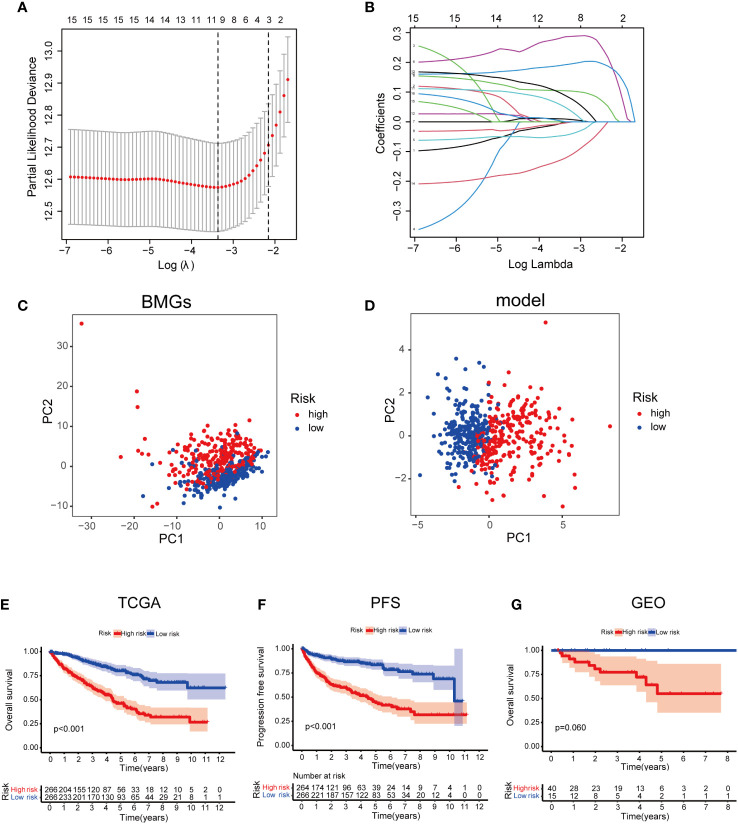
Figure 4.
Developing a PRS model using 10 BMGs. (A) Identification of 10 BMGs for a PRS model. (B) The LASSO coefficients of the 10 BMGs. (C) PCA on the basis of BMGs in KIRC. (D) PCA on the basis of risk scores to discriminate low- and high-risk score patients in the TCGA cohort. (E) Kaplan–Meier survival curves of OS in LRS and HRS groups in the GEO cohort. (F) Kaplan–Meier survival curves of OS in LRS and HRS groups in the TCGA cohort. (G) The comparison of PFS between LRS and HRS groups in the TCGA cohort.

