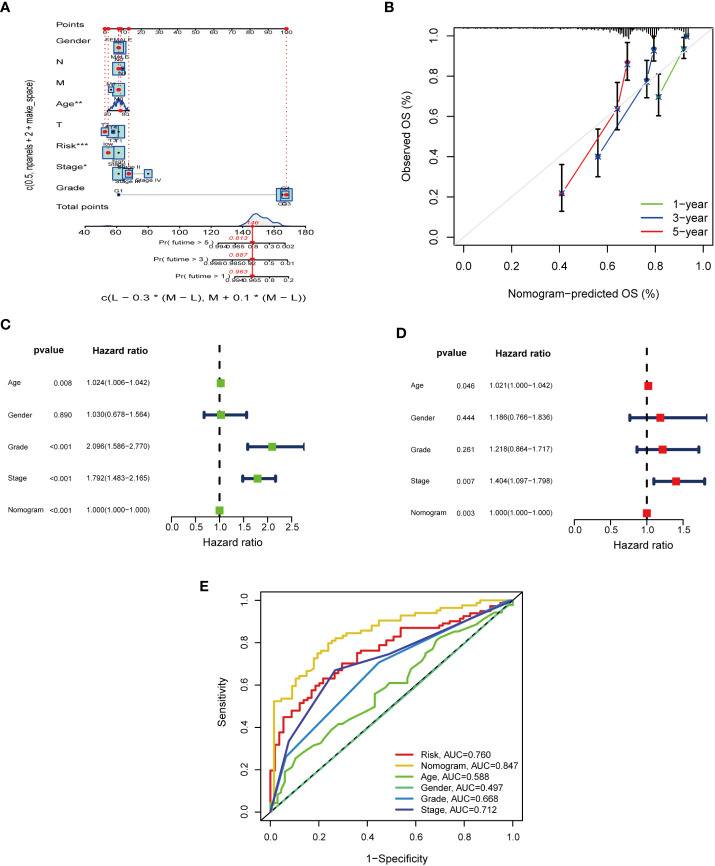
Figure 6.
The predictive value of nomogram design and nomogram scores when combined with pathological features in the TCGA cohort. (A) Nomogram predicting 1-, 3-, and 5-year OS in the TCGA cohort. (B) The calibration curves for 1-, 3-, and 5-year OS. (C, D). The multi-Cox-reg and uni-Cox-reg analyses of the nomogram and pathological features. (E) ROC curves for BM scores, nomogram, and pathological features.

