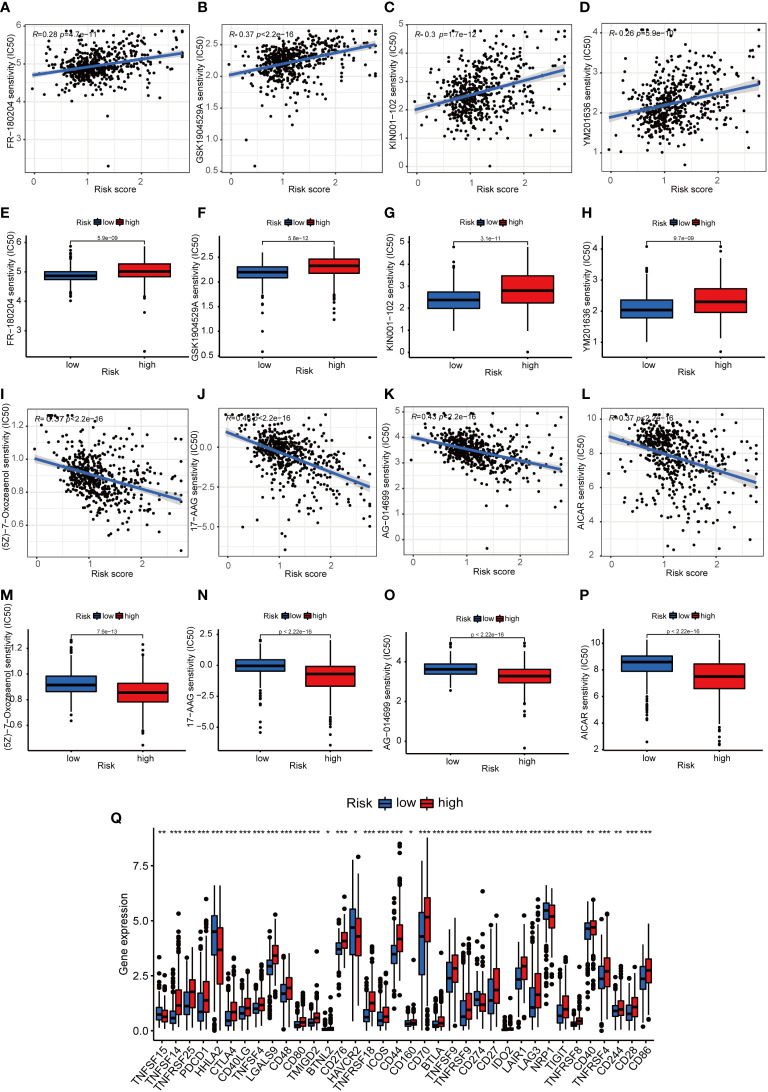
Figure 8.
The immunotherapeutic prognosis for risk-dependent groups. (A–D). The negative association of patients’ risk scores with IC50 values for chemotherapeutics. (E–H). IC50 values for chemotherapeutics in the HRS group were higher compared to the LRS group. (I–L). The negative association of patients’ risk scores with the IC50 values of chemotherapeutics. (M–P). The IC50 values of chemotherapeutic agents were lower in the HRS group compared to the LRS group. (Q). The expression levels of 18 checkpoints in various risk categories. *p< 0.05, **p< 0.01, and ***p< 0.001.

