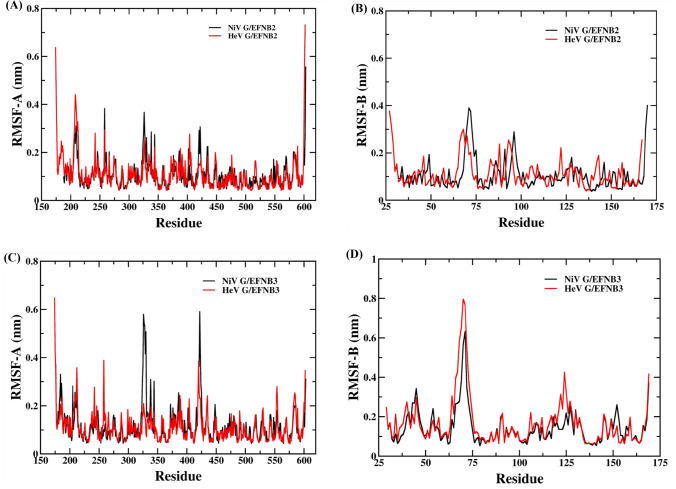
Figure 3.
Root Mean Square Fluctuation (RMSF) graph of Nipah and Hendra virus complexes (A) chain-A of NiV glycoprotein/EFNB2 and HeV glycoprotein/EFNB2 (B) chain-B of NiV glycoprotein/EFNB2 and HeV glycoprotein/EFNB2 (C) chain-A of NiV glycoprotein/EFNB3 and HeV glycoprotein/EFNB3 and (D) chain-B of NiV glycoprotein/EFNB3 and HeV glycoprotein/EFNB3 complexes during 250 ns MD simulation.

