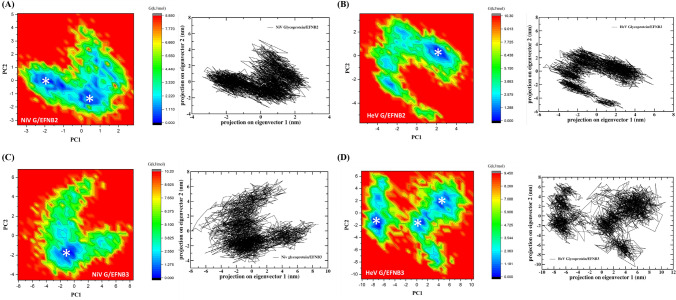
Figure 6.
Free energy landscape (FEL) along projections onto the 1st and 2nd principal components of the 250 ns MD concatenated trajectory. Asterisks (*) indicate the localization on the FEL of the average structures of the different conformational ensembles. Two-dimensional principal component analysis (PCA) projection of trajectories obtained from 250 ns MD simulations of NiV and HeV glycoprotein in complex with both EFNB2/B3, respectively are shown in black color graphs. The free energy is given in kJ/mol and indicated by color.

