
Fig. 2. Summary of meta-analytic insights into the correlates of conspiracy beliefs.
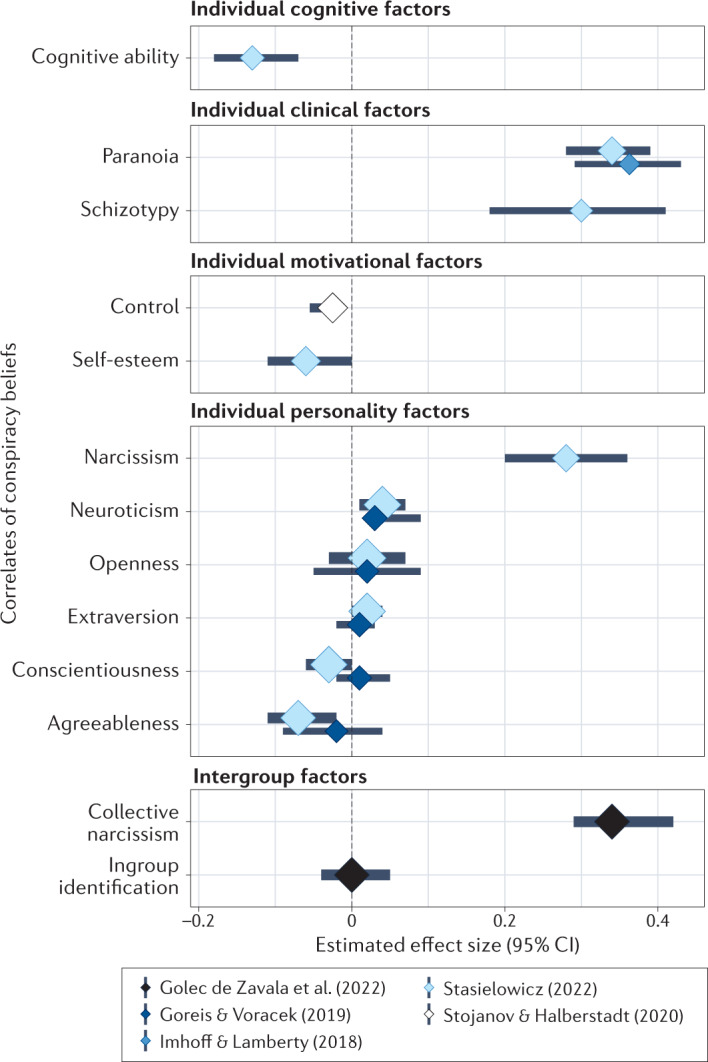
Estimated effect sizes and 95% confidence intervals for the correlations between individual-level and intergroup factors and conspiracy beliefs as reported by five meta-analyses. Marker size and line thickness represent the number of primary studies included in the meta-analysis: larger markers and thicker lines denote 30 primary studies; smaller markers and thinner lines denote 20 primary studies. CI, confidence interval. Data taken from refs.46,59,81,102,135.