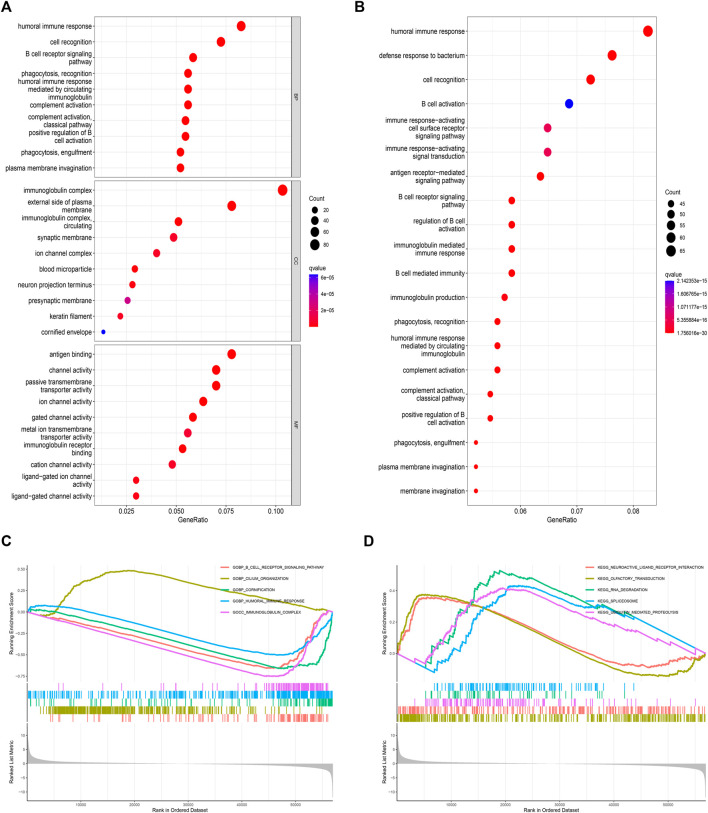
FIGURE 5.
Enrichment analysis of two groups of differentially expressed genes in PAIP2. (A): GO enrichment analysis of differential genes. (B): KEGG enrichment analysis of differential genes. (C): GSEA analysis based on GO analysis. (D): GSEA analysis based on KEGG analysis. (Circle size represents the proportion of genes in this biological process or signal pathway).

