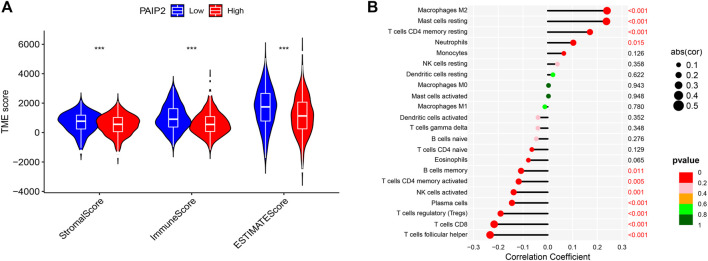
FIGURE 6.
Tumor microenvironment score and immune cell infiltration. (A): StromalScore, ImmuneScore and ESTIMATEScore of PAIP2 low expression group were significantly higher than those of PAIP2 high expression group (*represented p < 0.05, ** represented p < 0.01 and *** represented p < 0.001). (B): The expression of PAIP2 was significantly positively correlated with the infiltration of Macrophages M2, Mast cells resting, T cells CD4 memory resting and Neutrophils. It was significantly negatively correlated with T cells follicular helper, T cells CD8, T cells regulatory, plasma cells, NK cells activated, T cells CD4 memory activated and B cells memory.

