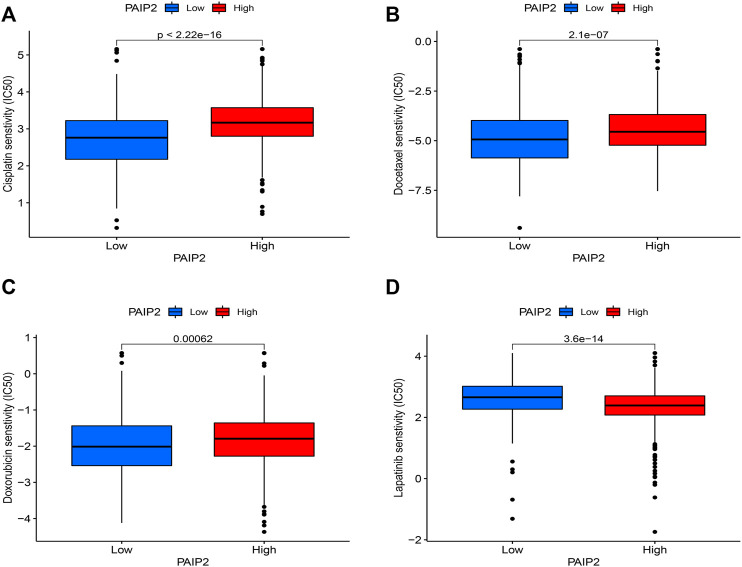
FIGURE 8.
Correlation between PAIP2 and drug sensitivity. (A): The expression of PAIP2 was positively correlated with the IC50 of Cisplatin and negatively correlated with the sensitivity of Cisplatin. (B): PAIP2 expression was positively correlated with the IC50 of Docetaxel and negatively correlated with the sensitivity of Docetaxel. (C): PAIP2 expression was positively correlated with Doxorubicin IC50 and negatively correlated with Doxorubicin sensitivity. (D): PAIP2 expression was negatively correlated with IC50 of Lapatinib and positively correlated with sensitivity of Lapatinib.

