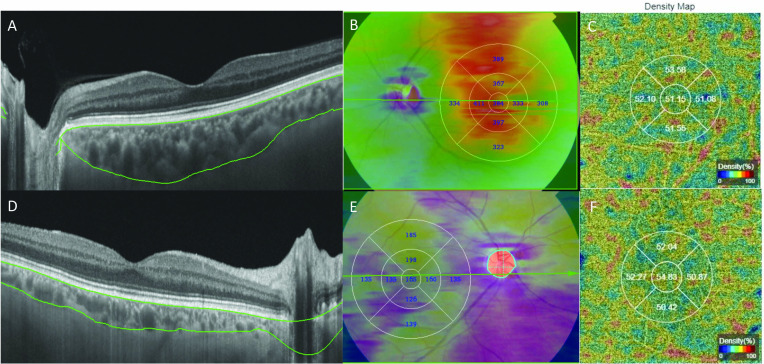
Figure 1.
Swept-source optical coherence tomography structural image for a patient with type 2 diabetes (T2D) with no diabetic kidney disease (nDKD) (A) showing segmentation lines for Bruch’s membrane and scleral-choroidal junction (green) with automated choroidal thickness map (B) and density map for choriocapillaris from OCT angiography measurements (C). Second row shows representative case of a patient with T2D with DKD that presented with decreased choroidal thickness as shown on the structural (D) scan and choroidal thickness map (E), however, there was no detectable decrease in choriocapillaris density (F).

