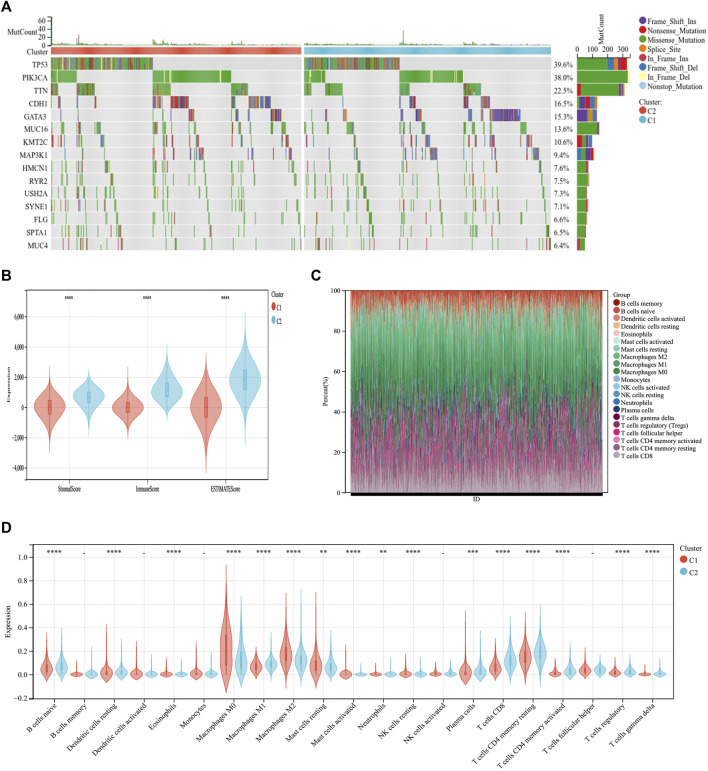
FIGURE 3.
Differential somatic mutations and immune infiltration in two ICD subtypes. (A) Gene mutation map showing that the 10 most commonly mutated genes in BC differ in mutations between the C1 and C2 groups. (B) ESTIMATE violin plot showing the differences in the stromal and immune cells infiltrating C1 and C2. (C) The relative proportions of immune-infiltrating types in C1 and C2. (D) CIBERSORT violin plot showing multiple differences in immune cell enrichment between the two ICD subtypes. *p < 0.05, **p < 0.01, ***p < 0.001, ****p < 0.0001.

