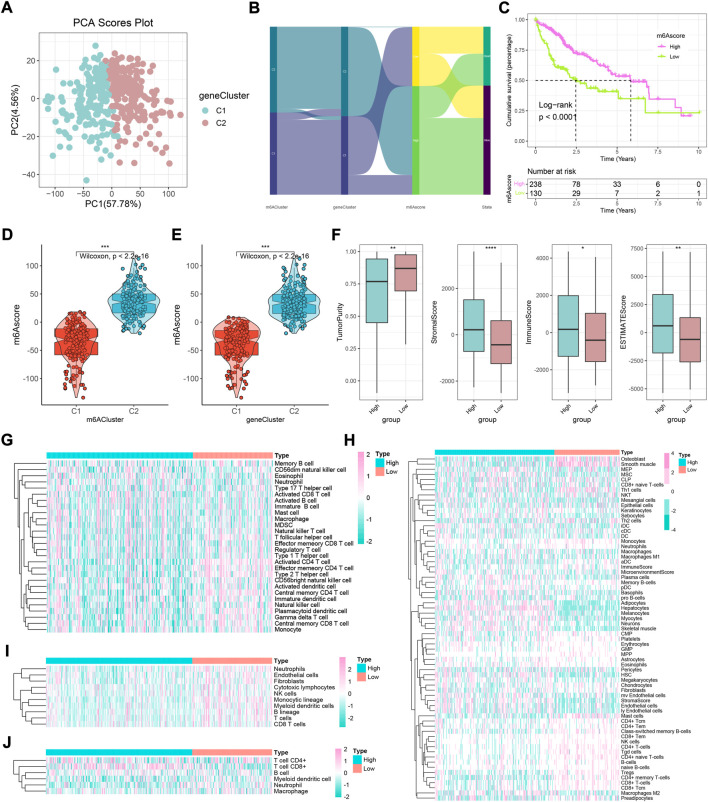
FIGURE 5.
Construction of an m6A gene signature and exploration of its clinical significance in HCC. (A) Two gene clusters by principal component analysis. (B) Sankey diagram showing the changes in m6A clusters, gene clusters, m6Ascore, and survival status. (C) Survival outcomes of patients by m6Ascore. The survival outcomes of patients in the low-m6Ascore group are better. (D) Variation analysis of m6Ascore between m6A clusters. (E) Variation analysis of m6Ascore between gene clusters. (F) Difference in ESTIMATE, immune, stromal, and tumor purity scores between high- and low-m6Ascore groups based on ESTIMATE algorithm (*p < 0.05, **p < 0.01, ***p < 0.001, ****p < 0.0001, and ns, not significant). (G–J) Heatmaps of immune cell infiltration in high- and low-m6Ascore groups based on ssGSEA, xCell, MCP-counter, and TIMER algorithms, respectively.

