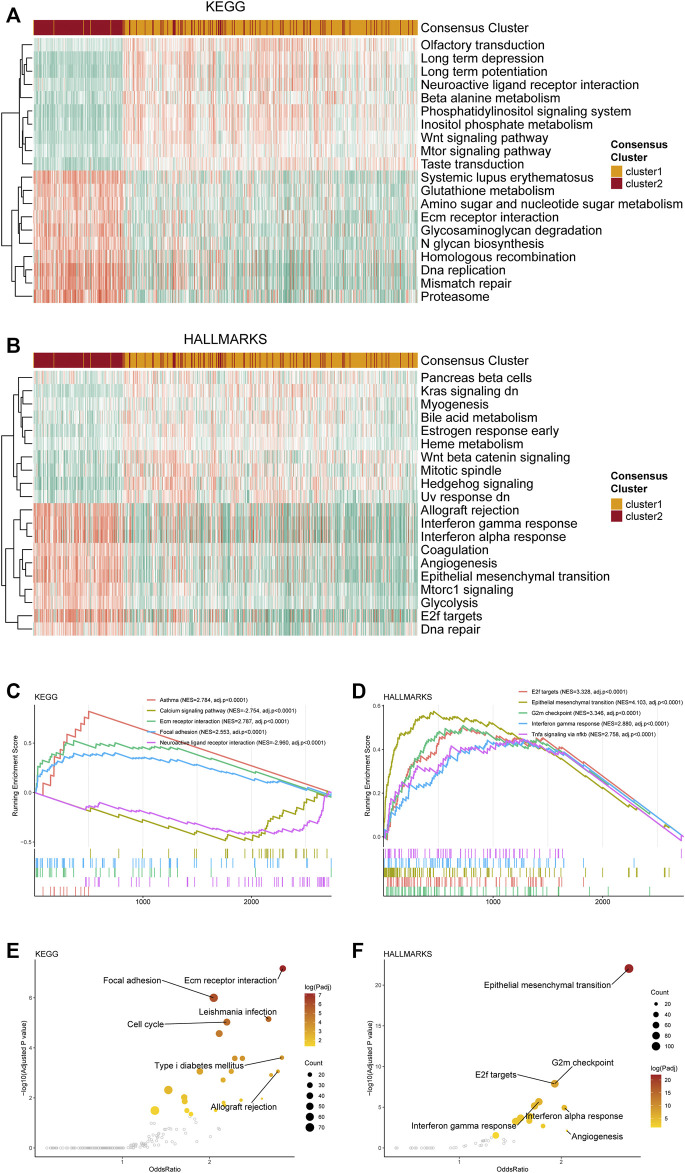
FIGURE 2.
Functional enrichment analysis of the transcriptome of the consensus clusters. (A) Top 20 differentially expressed KEGG gene sets. (B) Top 20 differentially expressed HALLMARKS gene sets. (C) The top five pathways with the highest normalized enrichment score in the KEGG gene sets between two clusters. (D) The top five pathways with the highest normalized enrichment score in the HALLMARKS gene sets between two clusters. (E) Pathways with high odds ratio and confidence in the KEGG gene sets. (F) Pathways with high odds ratio and confidence in the HALLMARKS gene sets.

