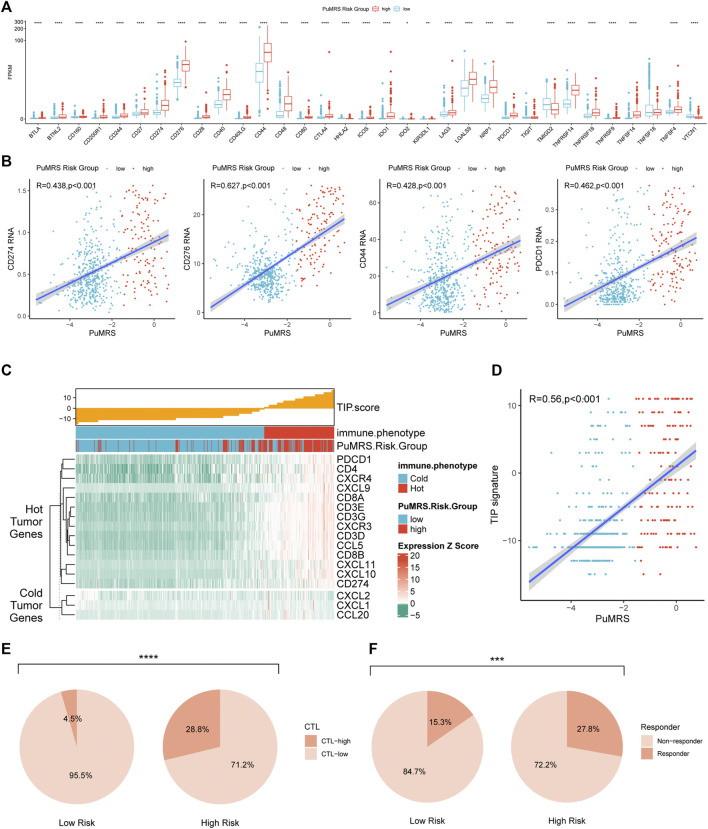
FIGURE 9.
Differences in expression of immunotherapy targets and response to ICIs between two PuMRS risk groups. (A) The expression level of 33 immunotherapy-related genes in two risk groups. (B) Analyses of correlations of PuMRS with the expression of CD274, CD276, CD44, and PDCD1. (C) TIP scores and related gene expression levels between two risk groups in TCGA datasets. (D) Analyses of correlations of PuMRS with the TIP score. (E) Percentage of predicted CTL level in each risk group. (F) Percentage of predicted responders to immune checkpoint inhibitors therapy in each risk group.

