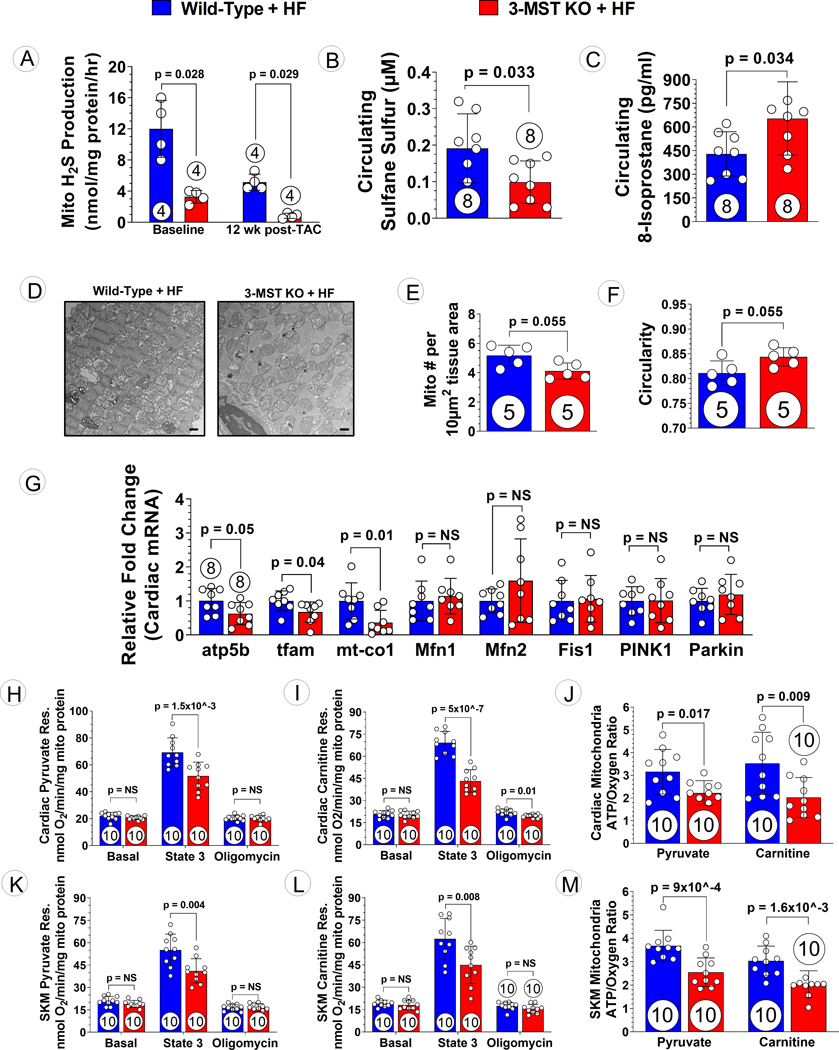
Figure 4: Mitochondrial Morphology, Respiration and ATP Synthesis Efficiency in 3-MST KO Mice after TAC.
(A) Mitochondrial H2S generation capacity using 3-mercaptopyruvate as substrate in Wild-type and 3-MST KO mice at baseline and 12 weeks post TAC. Circulating (B) Sulfane Sulfur and (C) 8-isoprostane in wildtype or 3-MST KO mice at 12 weeks post TAC. (D) Representative transmission electron microscopy microphotography of cardiac mitochondria from 3-MST KO + HF vs. WT + HF mice. Scale bar at the bottom right corner represents 1 μm. (E) Number of mitochondria per area and (F) circularity of the mitochondria quantified. (G) Relative fold changes in gene expression of atp5b, tfam, mt-co1, Mfn1, Mfn2, Fis1, PINK1, and Parkin. Respiration using (H) pyruvate or (I) carnitine as substrate and (J) ATP synthesis efficiency in mitochondria isolated from wildtype or 3-MST KO hearts. Respiration using (K) pyruvate or (L) carnitine as substrate and (M) ATP synthesis efficiency in mitochondria isolated from wildtype or 3-MST KO skeletal muscle. Circles inside bars indicates samples size. Data in (A), (E), and (F) were analyzed with Mann-Whitney test; data in other panels were analyzed with student unpaired 2-tailed t test. Data are presented as mean ± SD.

