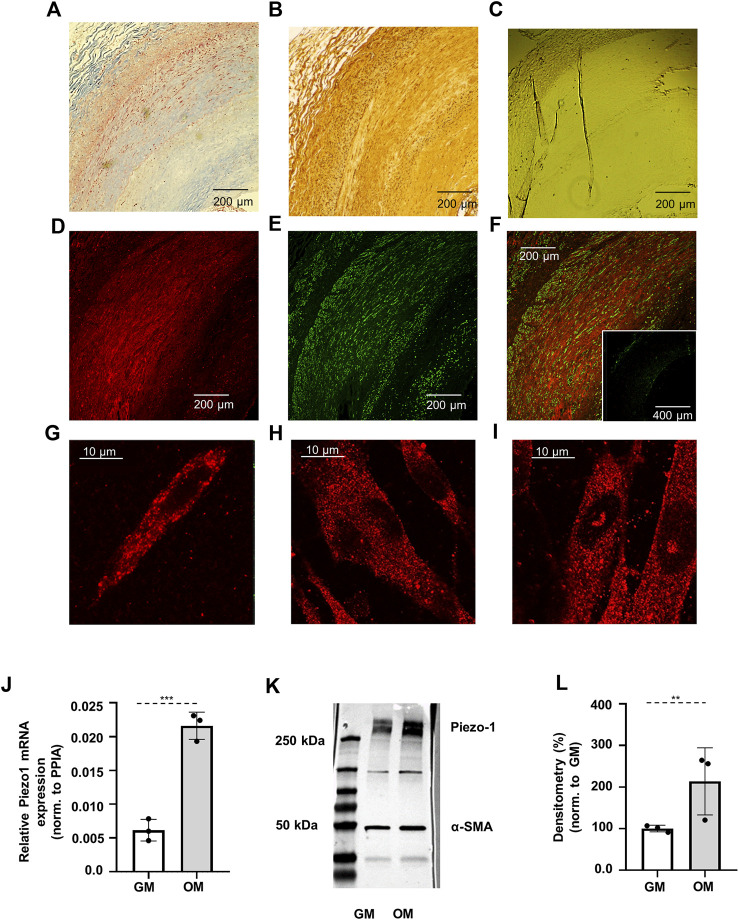
FIGURE 1.
Verification of the expression of Piezo1 channels. (A) Masson’s trichrome staining indicates the smooth muscle layer (red color) in the sections of human internal carotid artery sample obtained from vascular surgical interventions. (B) DAB staining for Piezo1. The appearance of brown color in the images demonstrates the presence of Piezo1. (C) Negative control for DAB staining. (D) Localization of Piezo1 in human carotid artery marked with Cy3 (red). (E) Immunostaining of smooth muscle specific alfa-actin (αSMA) was used to identify smooth muscle cells in the section (green, Alexa488). (F) Merged immunofluorescent image from Piezo1 and αSMA. Inset: negative control of immunofluorescence labeling. (G) Piezo1 expression on smooth muscle cell isolated from mouse abdominal artery, and (H–I) on control and calcified HAoSMCs, respectively. (J) qPCR analysis of Piezo1 at mRNA level on HAoSMCs under control (GM) and calcifying (OM) conditions. (K) Representative Western blot from control (GM) and calcified (OM) HAoSMCs labelled for Piezo1 and αSMA as reference. (L) Semi-quantitative estimation of Piezo1 protein expression on control (GM) and calcified (OM) HAoSMCs. Results represent 3 independent experiments performed in triplicate.

