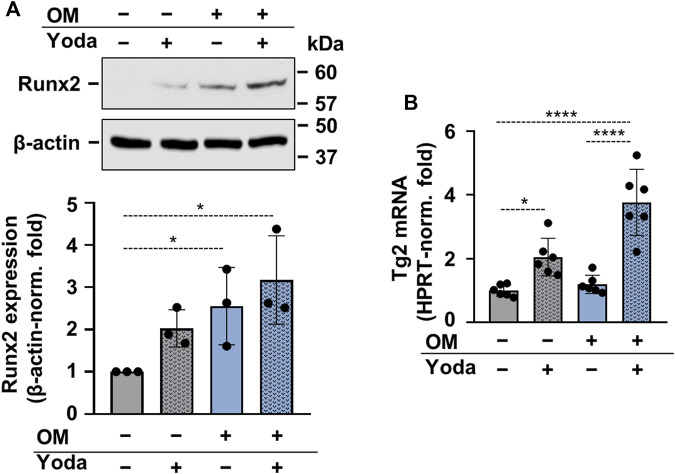
FIGURE 4.
Upregulation of Runx2 and Transglutaminase 2 (Tg2) in calcifying HAoSMCs (A,B) HAoSMCs were exposed to Yoda1 (10 μmol/L), OM (OM; excess Pi: 1.5 mmol/L, excess calcium: 0.6 mmol/L) or OM + Yoda1. (A) Protein expressions of Runx2 and β-actin were determined from whole-cell lysates (12 h). Representative Western blots out of three. β-actin-normalized relative expression of Runx2. (B) Tg2 mRNA levels were determined by quantitative RT-qPCR using HPRT as internal control (day 6). Data are presented as mean ± SD. *p < 0.05, ****p < 0.001.

