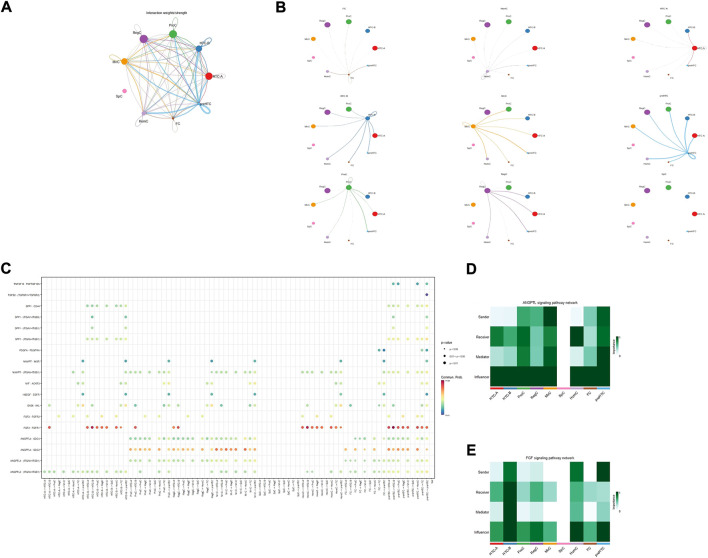
FIGURE 3.
Results for the cell–cell interaction among cell types. (A,B) Interaction weight for cell–cell communication among each cell type. The size of the circle represents the ratio of each cell type; the width of the line represents the strength of cell–cell communication. (C) Interaction probability for each pathway among cell types; the size and color of the circle represent the p-value and probability, respectively. (D,E) Heatmap for the role of each cell type in different pathways; the color of the rectangle represents the extent of importance in each role.

