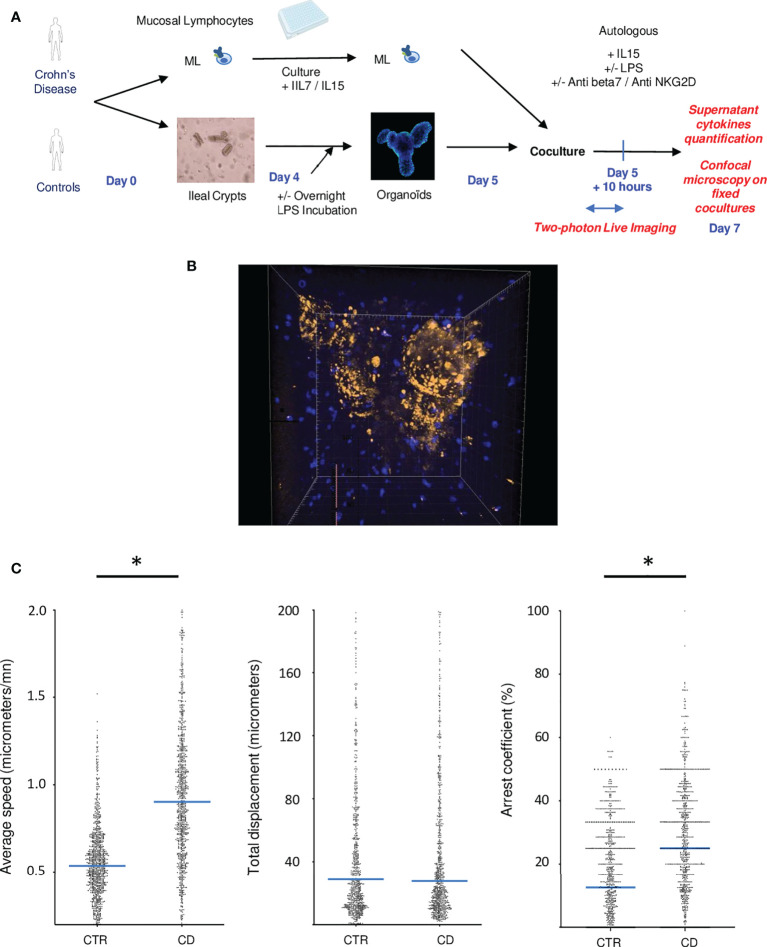
Figure 2.
Autologous co-cultures reveal direct interactions between mucosal lymphocytes and epithelial organoids especially in CD patients. (A) Experimental design of cocultures (B) Example of a two photon acquisition for a CD patient showing multiple interactions between T cells and an organoid. (C) Average speed, total displacement and arrest coefficient of lymphocytes in cocultures. Each dot corresponds to a lymphocyte. Cells from different individuals were combined in this figure. These figures represent 2 control patients and 3 IBD patients. CD= Crohn’s Disease, CTR= Control. *p < 0.05 Mann Whitney Test.

