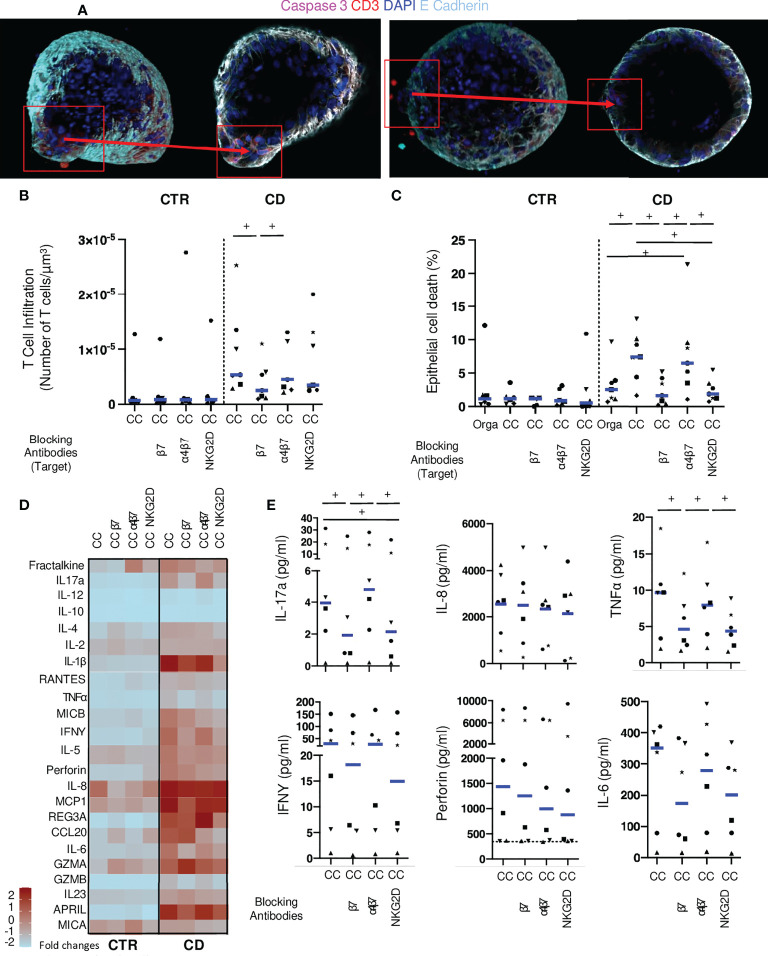
Figure 4.
Monoclonal antibodies targeting lympho-epithelial interactions reduce epithelial cell death in co-cultures. (A) Organoid in coculture with mucosal T cells from CD patients without (left) or with anti-beta7 (right) in confocal microscopy (200X: Blue: DAPI; Light Blue: E-Cadherin, Red CD3, Pink: Caspase 3). (B) T cell infiltration in the organoids evaluated by the number of CD3 positive-cells in contact or infiltrating each organoid with LPS incubation. Each dot corresponds to the median of the values obtained for organoids of a given patient. Each shape of point corresponds to a given patient. CTR: n=6, CD: n=7. (C) Organoid epithelial cell death evaluated by Caspase 3 fluorescence area over organoid volume in organoids alone or cocultures with LPS incubation. CTR: n=6, CD: n=7. (D) Cytokine detection matrix in the supernatant in LPS coculture conditions. Each square represents the median value of the results obtained for each well of a given condition in the distinct patients. The color of each square stands for the level expression (Form light blue: low expression to deep red: high expression). CTR: n=6, CD: n=6. (E) Absolute values of cytokine quantification of 6 analytes (IL-17a, IL-8, TNFalpha, IFNgamma, Perforin and IL-6) for CD patients. Each dot corresponds to the absolute value obtained for a given condition (with LPS). Each shape of point corresponds to a given patient. CC= Coculture, CD= Crohn’s Disease, CTR= Control, ML= Mucosal Lymphocytes, Orga= Organoid. +: p < 0.05 Wilcoxon paired test.

