Figure 2.

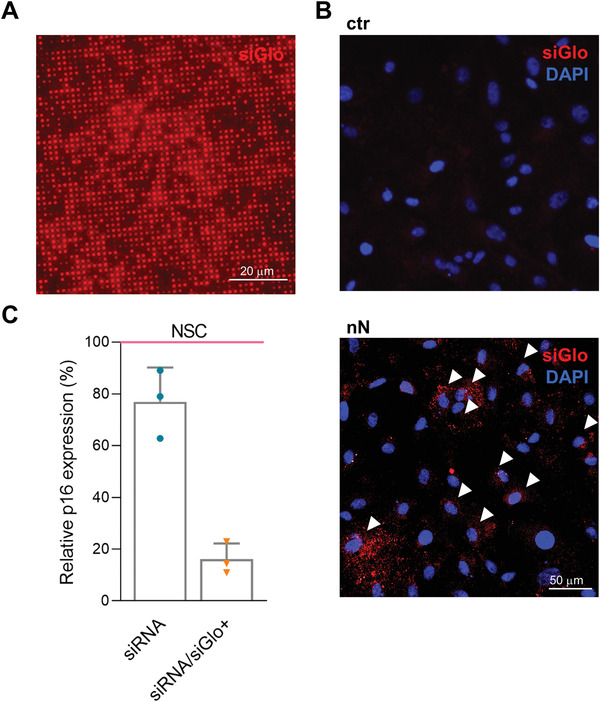
In vitro nanoinjection of p16 (CDKN2A) siRNA in HCEnCs. A) Fluorescence microscopy of nanoneedles loaded with siGlo siRNA. siRNA is adsorbed uniformly across the nanoneedles. Scale bar 20 µm. B) Fluorescence microscopy of HCEnCs 48 h following nanoinjection of siGlo. siRNA accumulates in the cytosol of the cells upon nanoinjection (nN), as compared with the untreated HCEnCs (ctr). White arrows indicate some of the highly transfected cells. siGlo signal (red) with DAPI (blue) nuclear counterstain. Scale bar 50 µm. C) RT‐PCR of p16 expression showing silencing 48 h following p16‐siRNA nanoinjection, normalized and compared to NSC (nonspecific control, pink line). Experiment performed on three primary HCEnCs strains derived from different donors at passage 1 in culture (n = 3). The bar on the left (dark blue) indicates overall silencing level, the bar on the right (light blue) is normalized to the fraction of siGlo‐transfected cells in culture. Data are expressed as mean + SD.
