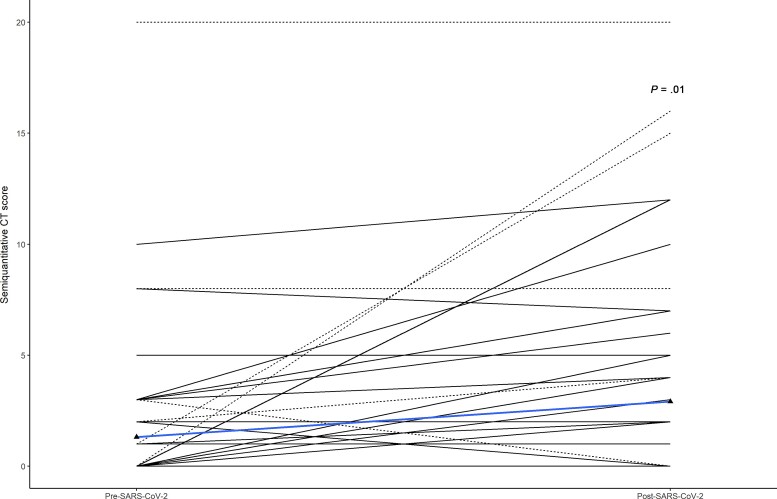
Figure 3.
Computed tomography (CT) scores before and after severe acute respiratory syndrome coronavirus 2 (SARS-CoV-2) infection. Shown is the individual dynamic in CT score at pre– and post–SARS-CoV-2 examination. Admitted individuals are represented as dotted lines. The blue line represents median score before and after SARS-CoV-2 infection.

