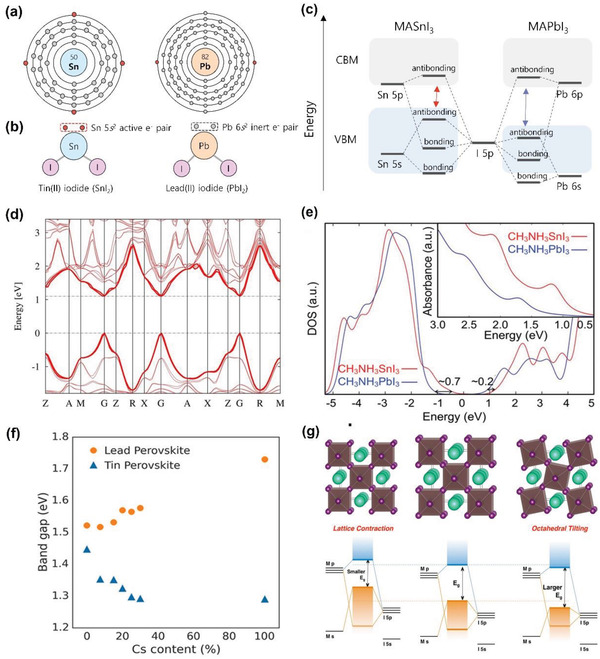
Figure 5.

Electronic band structure of THPs. a) Electronic structure of Sn and Pb atoms. b) Schematics of s state valence electrons in SnI2 and PbI2. c) Energy band schematics of MASnI3 and MAPbI3. d) GW + SOC calculated band structure of MASnI3. e) GW + SOC calculated electronic DOSs and optical absorption spectra (inset) of MASnI3 and MAPbI3. d,e) Adapted with permission.[ 48 ] Copyright 2014, Nature Publishing Group. f) Optical bandgaps of THPs and LHPs FA1‐ x Cs x SnI3 (0 ≤ x ≤ 1) as a function of Cs content. g) Perovskite lattice diagrams (top row) and corresponding energy level diagrams (bottom row) of lattice contraction (left panel), normal lattice (center panel), and octahedral tilting (right panel). f,g) Reproduced with permission.[ 66 ] Copyright 2017, American Chemical Society.
