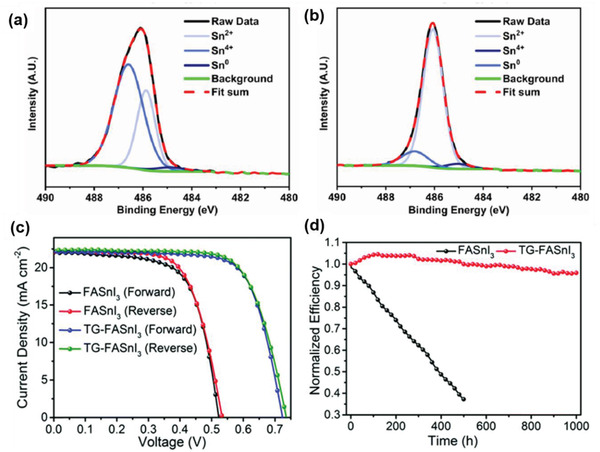
Figure 14.

Post‐treatment–narrow XPS spectra after 10 s of argon etching of a) 0 mm edamine and b) 0.05 mm edamine‐passivated FA0.98EDA0.01SnI3 samples. a,b) Reproduced with permission.[ 168 ] Copyright 2021, American Chemical Society. c) Pretreatment—The J–V curves of FASnI3 and TG‐FASnI3‐based TPSCs. d) The stability test of the corresponding device under simulated AM 1.5 G (100 mW cm−2) operating at MPPT c,d) Reproduced with permission.[ 169 ] Copyright 2021, Royal Society of Chemistry.
